Interface Performance Report
The Interface Performance Report provides an overview of interface performance over different time intervals. Each column represents a key metric that helps assess interface health, traffic volume, errors, and utilization.
How it helps
- Identifying bandwidth bottlenecks: If received traffic reaches 100%, it indicates the interface is maxed out, leading to potential packet loss or slow performance.
- Monitoring network performance for optimization: By analyzing traffic trends, IT teams can determine if a link needs an upgrade or redistribution of load.
- Detecting interface health issues: High error counts can indicate faulty hardware, misconfigurations, or connectivity issues.
- Detecting abnormal network activity: A sudden spike in received packets could indicate a DDoS attack or heavy incoming traffic.
- Helping with root cause analysis: If an interface is experiencing high packet discards, errors, or congestion, this report helps pinpoint when and where it happened.
- Correlating traffic trends with network events: IT teams can pinpoint specific times when high traffic or unusual packet behavior occurs.
Generate Interface Performance Report
- Log in to your Site24x7 account.
- Navigate to Reports and search for Network Device > Interface Performance Report.
- Change the listed parameters to view a customized report:
- Select the required monitor from the Monitors drop-down menu.
- Select Interfaces from the Resource Type drop-down menu.
- Select the required interfaces from the Resources drop-down menu.
- Next, select the Time Period and the Unit of Time.
- Then select Business Hours.
- Select Attribues from the drop-down menu.
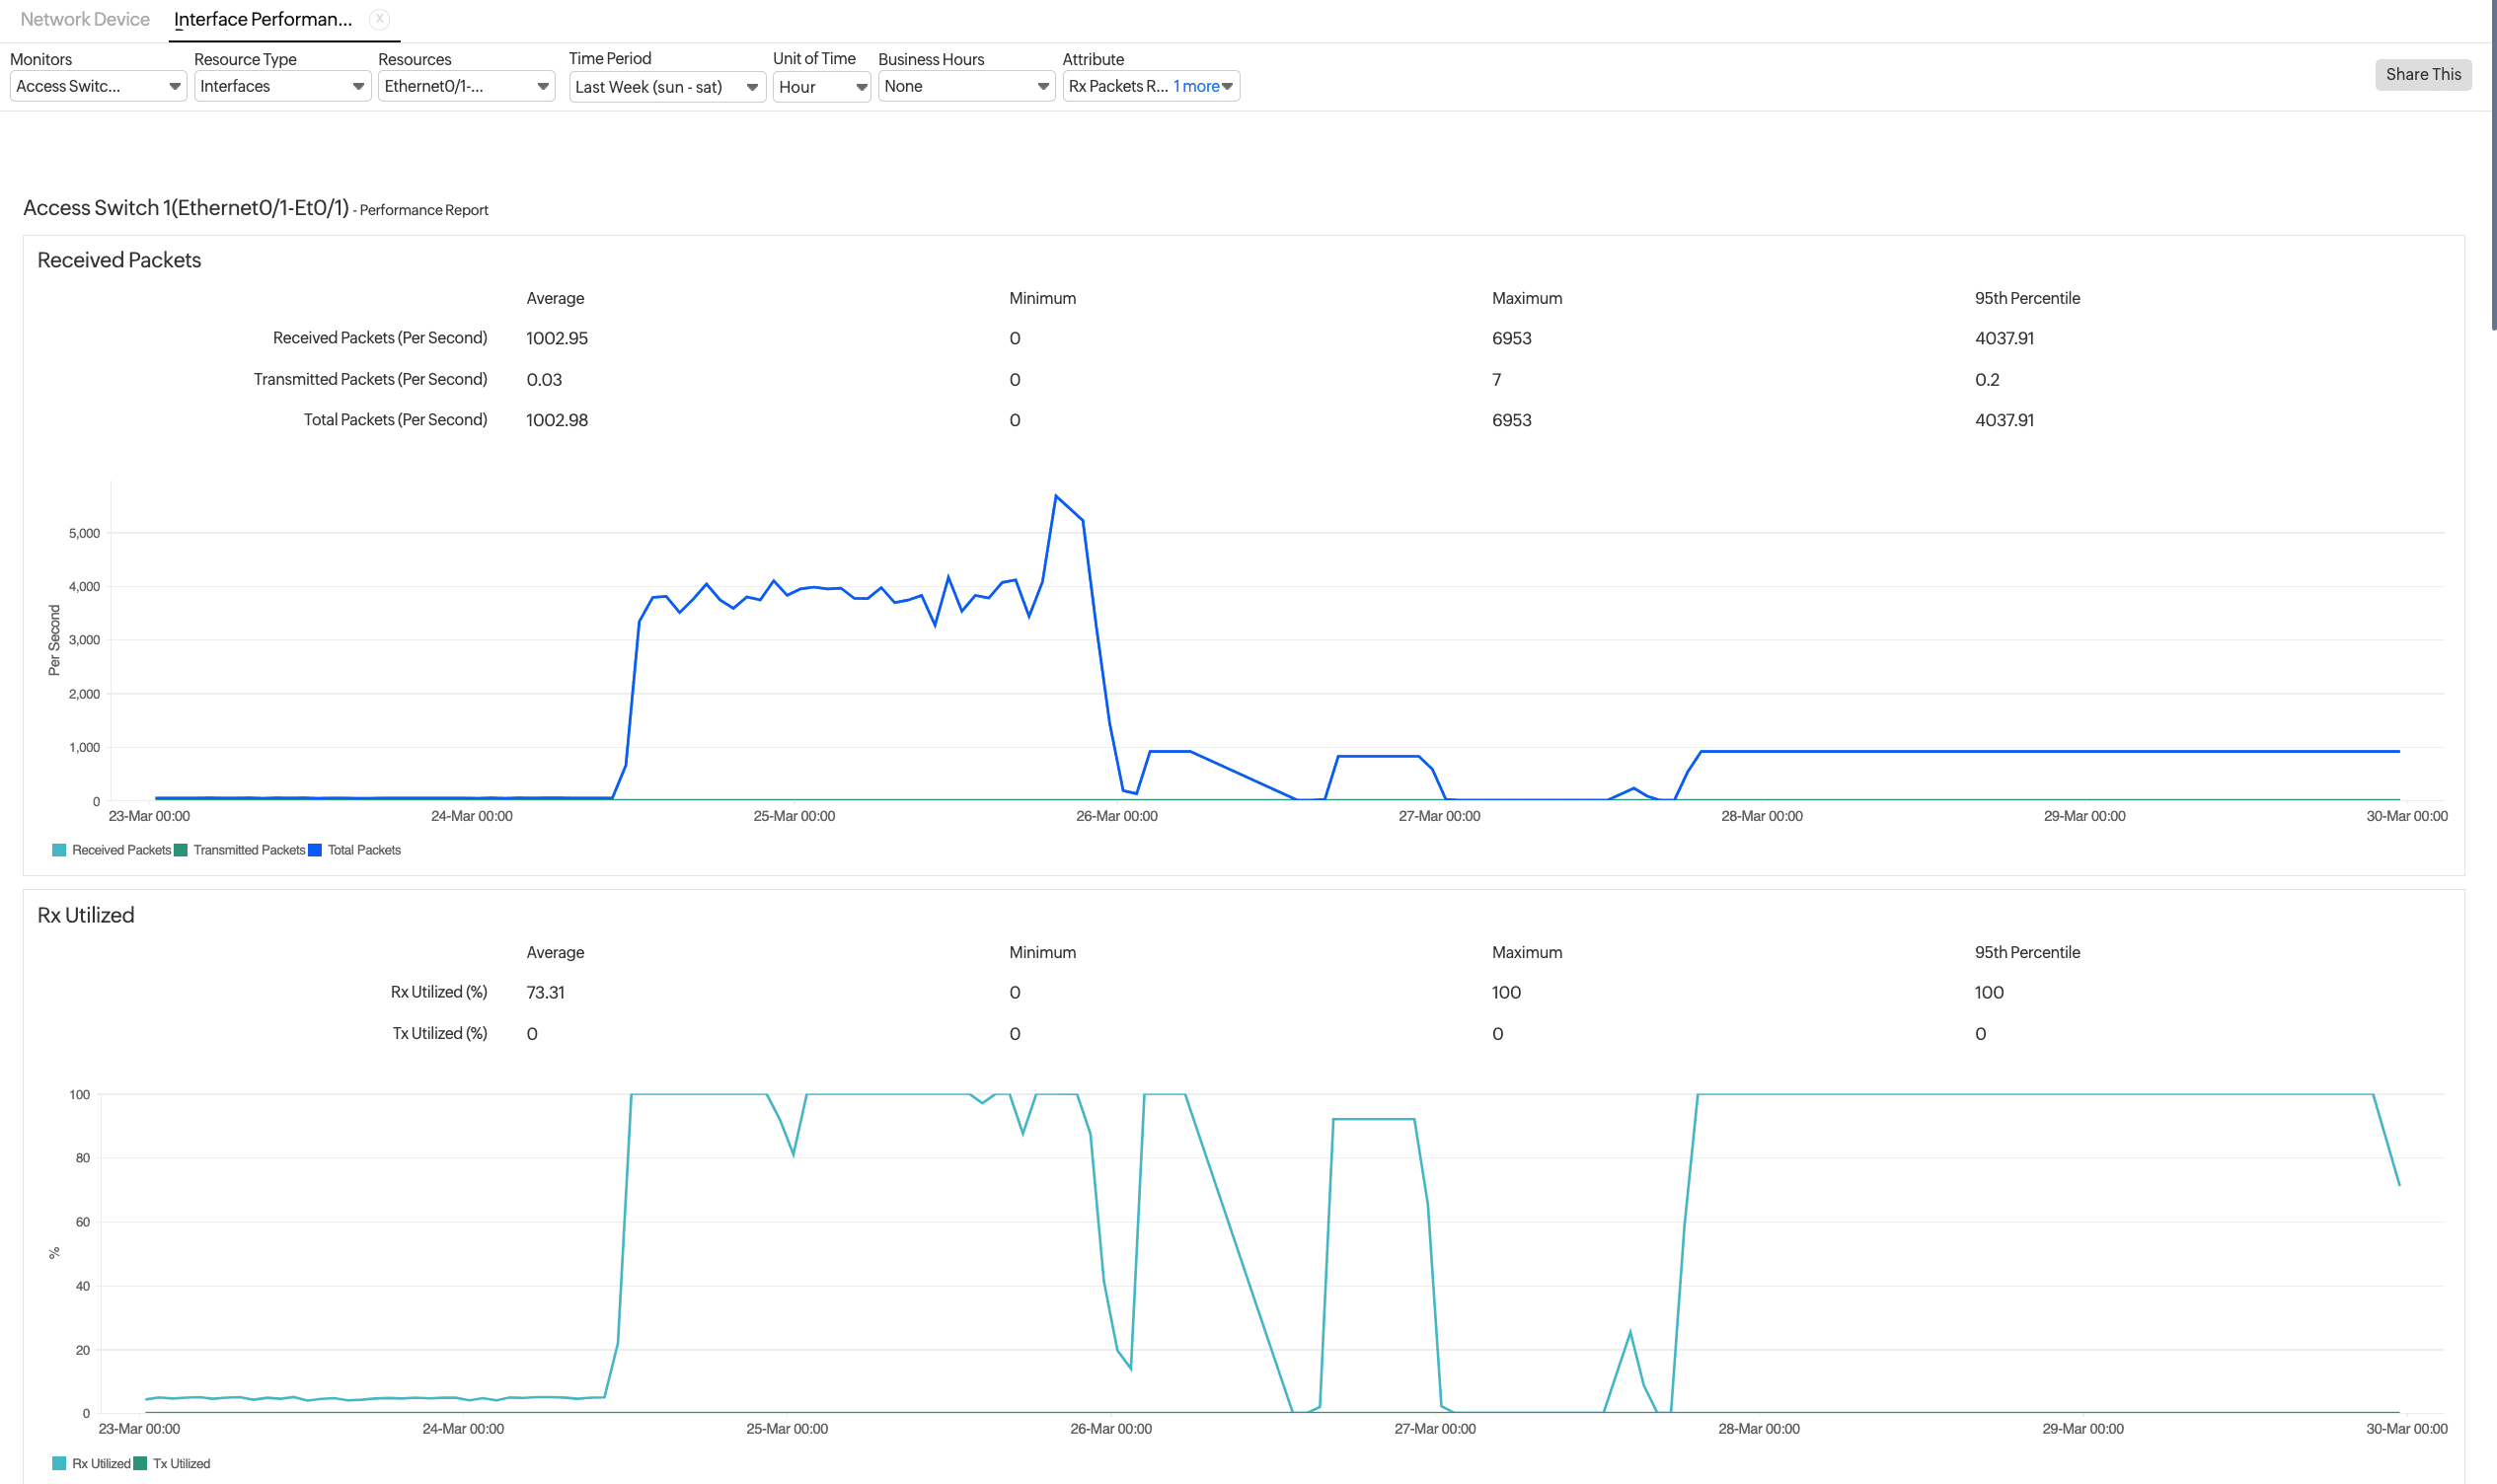
- You can now view the following metrics either as a table or a graph according to your selection in the Attributes field:
Metric Description Time Represents the timestamp of the recorded data. Out Errors (Count) The total number of errors encountered while transmitting (sending) packets. High values may indicate network congestion, faulty hardware, or link issues. Errors (%) The percentage of total packets that encountered errors during transmission. Should be close to zero for optimal performance. Rx Volume (MB) The total volume of data received in megabytes. Helps in understanding incoming traffic trends. Total Traffic (Mbps) The sum of received and transmitted data in megabits per second (Mbps). Gives an overview of overall bandwidth usage. Rx Utilized (%) Percentage of interface bandwidth utilized for receiving traffic. High values indicate that the interface is heavily used and may be close to capacity. Received Packets (Per Second) The number of packets received by the interface per second. A sudden increase could mean a surge in network activity or a DDoS attack. Total Packets (Count) The total number of packets (received and transmitted) handled by the interface. Discards (%) The percentage of packets that were discarded due to congestion or policy enforcement. High values indicate network congestion or performance issues. Transmitted Packets (Per Second) The number of packets sent out per second. Helps determine the amount of outbound traffic. In Discards (Count) The count of received packets that were dropped due to congestion, buffer overflow, or policy enforcement. Tx Utilized (%) The percentage of bandwidth used for transmitting data. If 100%, the interface might be overloaded, leading to delays or packet loss. Total Volume (MB) The sum of all received and transmitted data volume in megabytes. In Traffic (Mbps) The rate at which data is coming into the interface (in Mbps). Tx Volume (KB) The amount of data sent out by the interface in kilobytes. Out Traffic (bps) The outbound traffic rate in bits per second (bps). Useful for monitoring outgoing bandwidth usage. In Errors (K) The total number of errors encountered while receiving data. Can indicate cabling issues, network congestion, or hardware failure. Out Discards (Count) The number of packets dropped during transmission due to network congestion or insufficient buffer space. 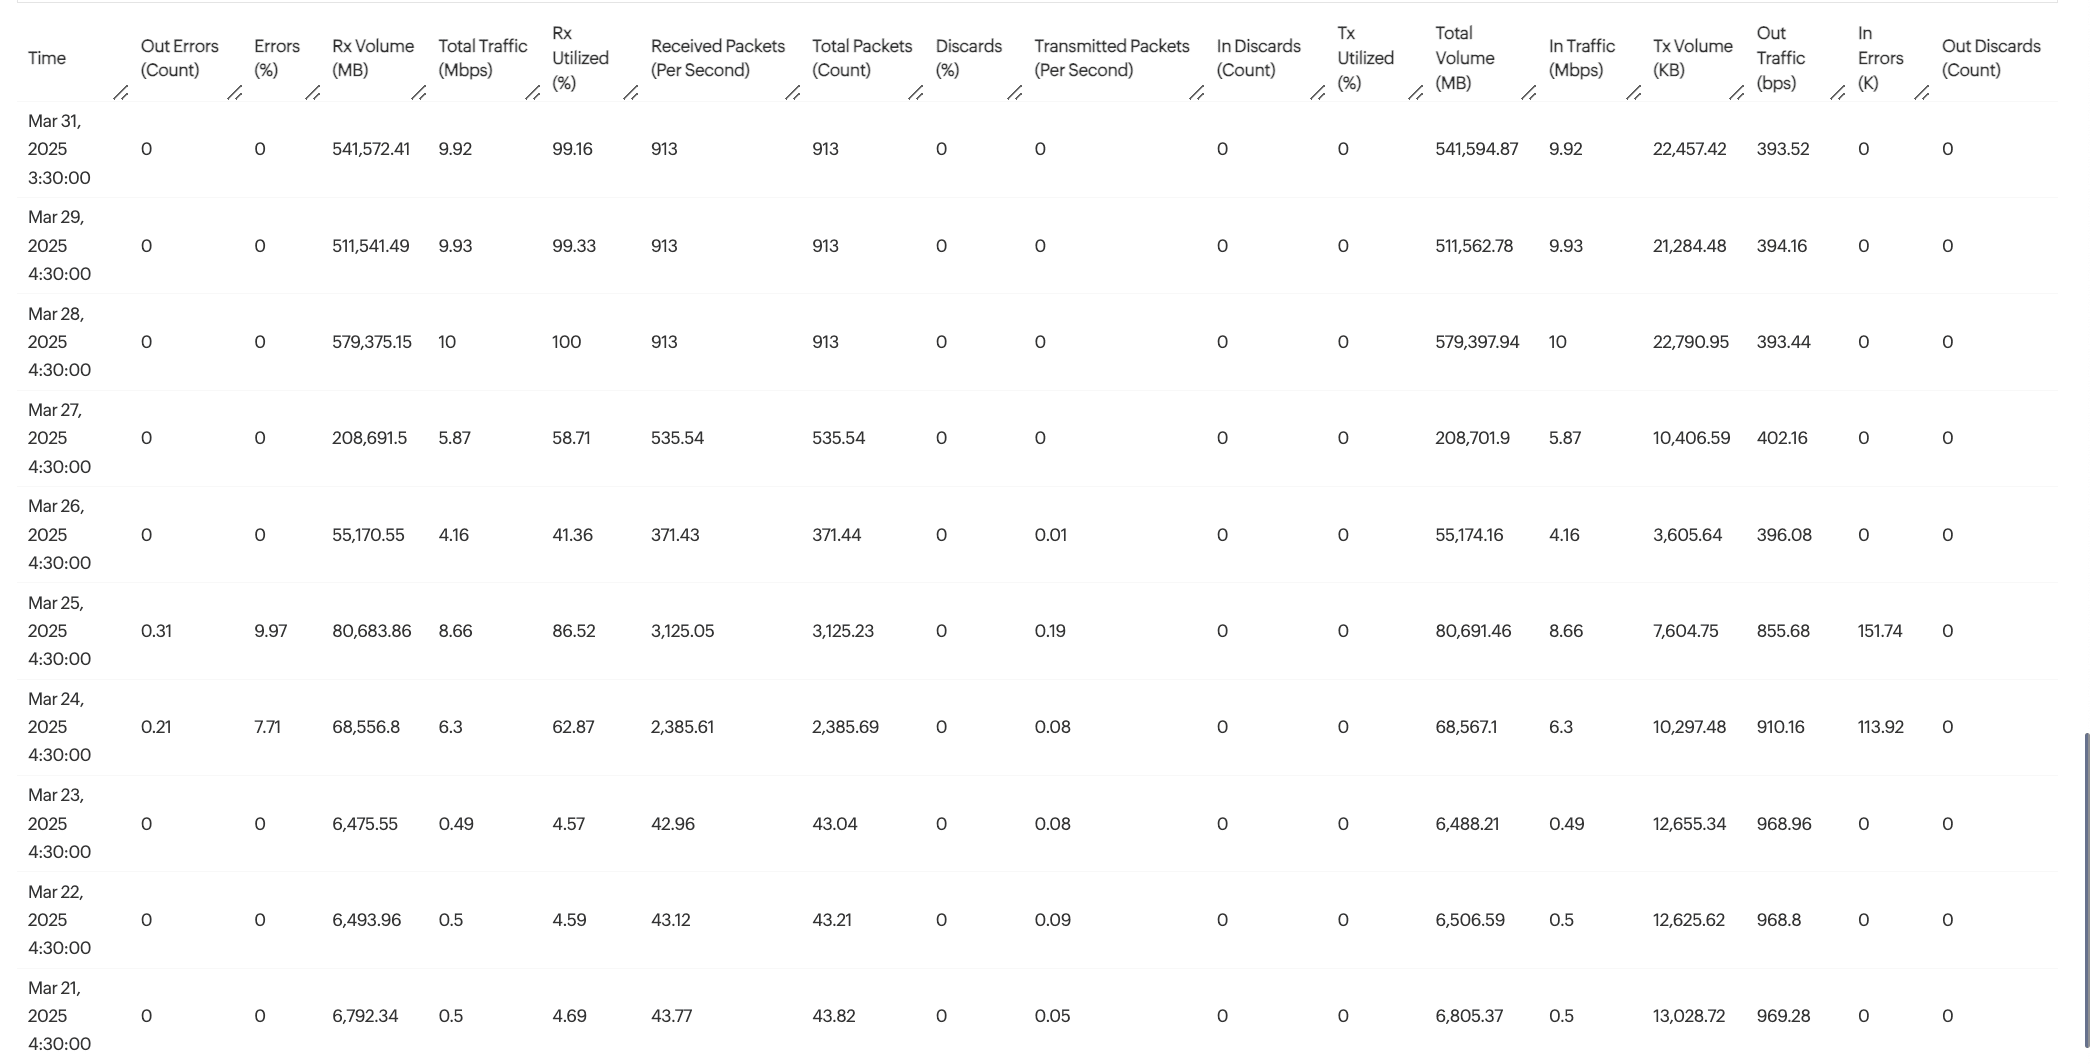
- Once the report is generated, click the Share This button in the top-right corner, then select one of the following:
- Export CSV: Export the report as a CSV file.
- Export PDF: Export the report as a PDF file.
- Email: Share the report via an email to those verified users who've opted to receive email notifications from Site24x7.
- Schedule Report: Populate the Schedule Report form to create a report task that will trigger performance reports to be sent to a customer.
-
On this page
- How it helps
- Generate Interface Performance Report