Interface Availability Summary Report
The Interface Availability Summary Report provides an overview of the availability of network interfaces across monitored devices over a specified time period. This report helps IT teams track interface uptime, downtime, performance, mean time to repair (MTTR), mean time between failures (MTBF), and more.
How it helps
- Monitoring network reliability: IT teams can measure how stable the router and its interfaces are.
- Pinpointing outage causes: See which interfaces failed, when, and for how long.
- Assessing efficiency of repairs: Gauge how quickly issues are resolved and how often failures occur using the MTTR and MTBF metrics.
- Assisting decision-making: Help teams improve network resilience by addressing recurring issues.
Generate an Interface Availability Summary Report
- Log in to your Site24x7 account.
- Navigate to Reports and search for Network Device > Interface Availability Summary Report.
- Change the listed parameters to view a customized report:
- Select the required Monitor from the Monitors drop-down menu.
- Select Interfaces in the Resource Type drop-down menu.
- Select the required interfaces in the Resources drop-down menu.
- Next, select the Time Period.
- Then select Business Hours.
- Select Locations, if available.
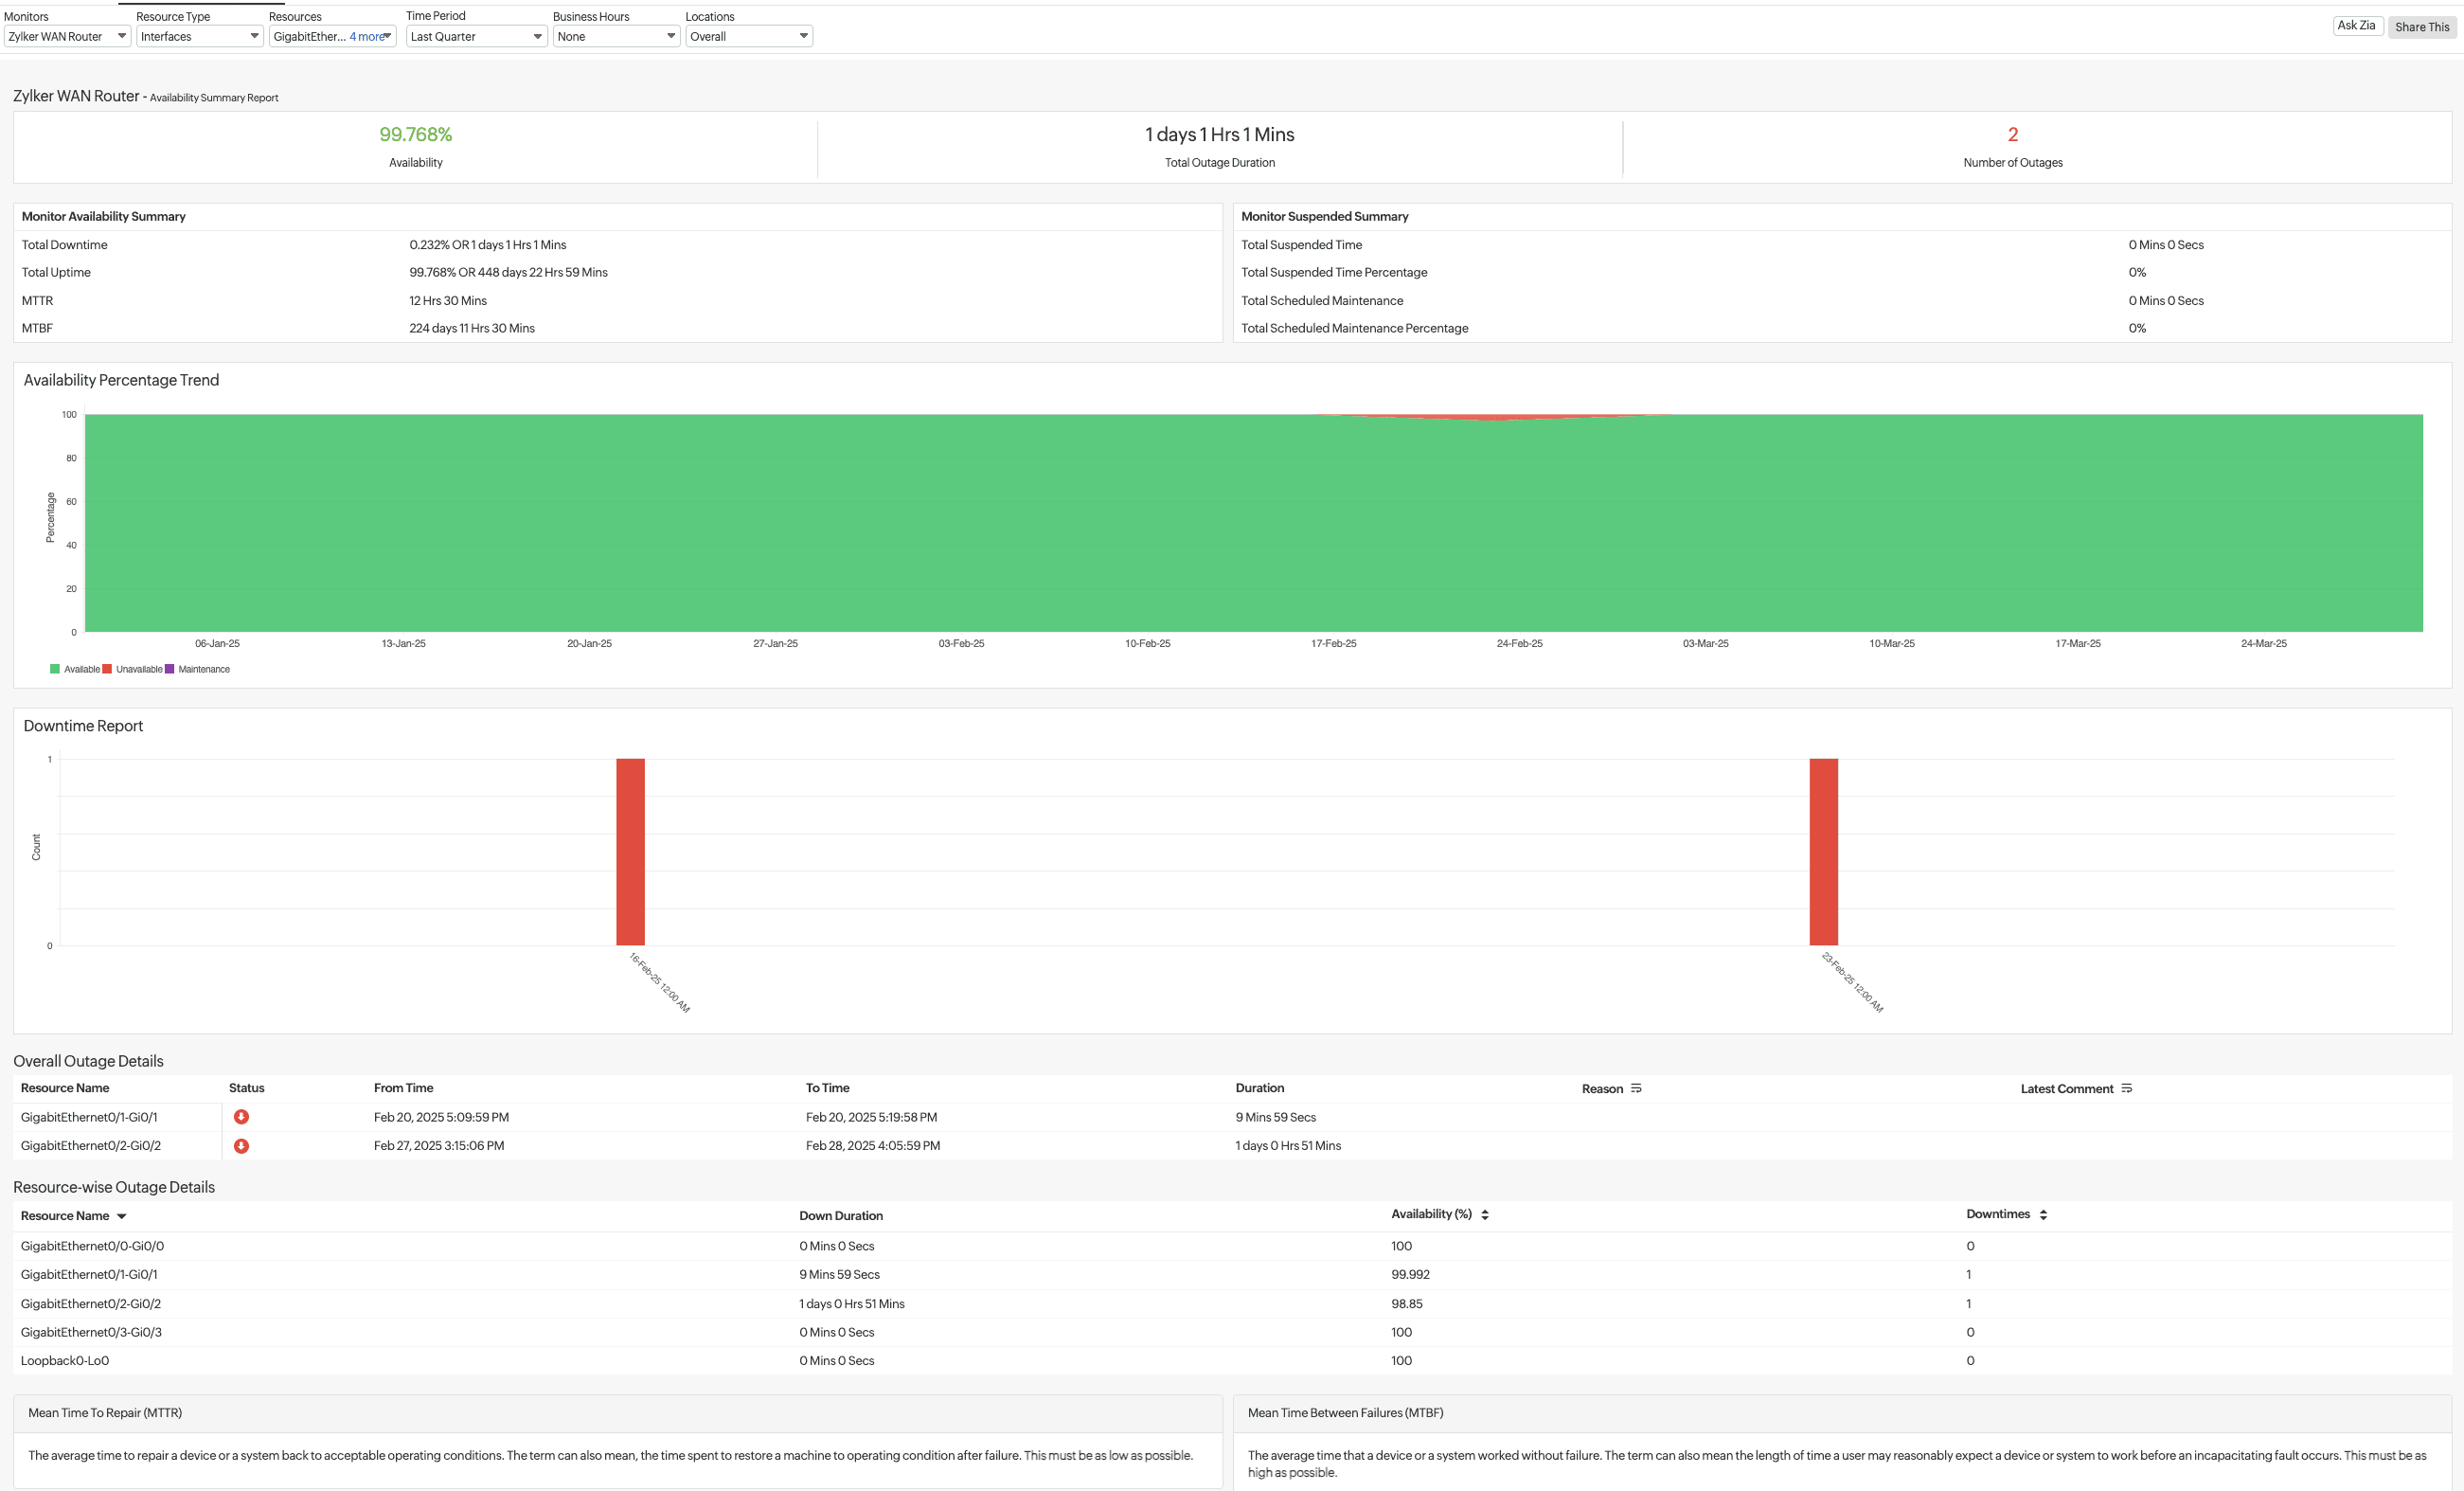
- You can now view the following metrics:
Metrics Description Availability Represents the percentage of time the monitor was operational Total Outage Duration Displays the total downtime recorded for the monitoring period Number of Outages Shows the total number of incidents during which the monitor was unavailable Monitor Availability Summary Total Downtime The percentage of the total time the interface was down Total Uptime The exact duration the interface was functional MTTR The average time taken to restore the interface after a failure—lower values indicate faster recovery MTBF The average time between failures, showing reliability—higher values are better Monitor Suspended Summary Total Suspended Time The time the monitor was paused (if any) Total Suspended Time Percentage The total range of the monitored period that was intentionally suspended Total Scheduled Maintenance Duration of downtime due to scheduled maintenance Total Scheduled Maintenance Percentage The percentage of time the device was down for planned maintenance Graphs Availability Percentage Trend A visual representation of uptime and downtime over the selected period Green represents available time, red indicates downtime, and purple represents maintenance Downtime Report Shows a graphical summary of outage incidents—helps in identifying patterns in failures and troubleshooting issues Overall Outage Details Resource Name The affected interface name Status Indicates whether the outage was resolved or is ongoing From Time The start and end timestamps of each outage To Time Duration The duration of the outage in hours and minutes Reason The cause of the outage (if documented) Latest Comment Any additional remarks related to the outage Resource-wise Outage Details Resource Name The affected interface Down Duration The time each resource was unavailable Availability (%) The uptime percentage for each resource Downtimes The number of times the resource experienced failure - Once the report is generated, click the Share This button in the top-right corner.
- Export CSV: Export the report as a CSV file.
- Export PDF: Export the report as a PDF file.
- Email: Share the report via email. Emails can be sent to only those verified users who have agreed to receive emails from Site24x7.
- Schedule Report: Populate the Schedule Report form to create a report task that will trigger the Interface Availability Summary Report emails to the customer.