Internet gateway monitoring
In Oracle Cloud Infrastructure (OCI), an internet gateway lets resources in a public subnet connect to the internet. It provides a path for both inbound and outbound traffic and is essential for workloads that require direct internet access, such as web servers or APIs.
Site24x7's monitoring for OCI's internet gateways gives you visibility into how your gateway is used and enables you to ensure reliable connectivity for your public-facing resources.
Overview
In most production environments, the internet gateway acts as the entry and exit point for critical applications. If it's misconfigured, becomes unavailable, or is deleted, public access to your services can break immediately. Despite its importance, native monitoring in OCI for internet gateways is limited. There's no direct alerting for availability or configuration issues unless you manually track them through logs or network troubleshooting.
Site24x7's integration addresses this gap by bringing internet gateway monitoring into your existing infrastructure visibility. You can now view the availability, configuration status, and related metrics of your internet gateway alongside other monitored OCI resources. This helps in early detection of potential issues and reduces the time spent troubleshooting connectivity problems.
Use case
Imagine a team running a set of public-facing microservices on OCI, hosted in a public subnet within a virtual cloud network (VCN). These services are accessed by customers through the internet. The internet gateway configured for the VCN is the single point that allows these services to send and receive traffic externally. One day, customers report that the application is unreachable. The engineering team starts investigating but doesn’t find any issues with the application servers or the load balancer.
Using Site24x7, they quickly check the status of the internet gateway and see that it has been accidentally detached from the VCN during a recent configuration update. Because Site24x7 provides visibility into the internet gateway’s attachment status and routing dependencies, the team can identify and fix the issue quickly. If the gateway is deleted or disabled, Site24x7’s alerting will flag it in real time.
This integration helps reduce the mean time to resolution, prevents prolonged downtime, and avoids the need for extensive manual debugging across the network stack.
Benefits of Site24x7's internet gateway integration
Integrate your internet gateway with Site24x7 and leverage the following benefits:
- Maintain connectivity: Ensure availability of critical outbound and inbound communication paths for your cloud resources.
- Monitor traffic patterns: Track traffic flow and detect abnormal spikes or drops that may indicate issues.
- Optimize configurations: Identify misconfigurations or unused gateways to optimize your cloud setup.
- Troubleshooting support: Use historical data to identify when and where connectivity issues occurred.
- Proactive alerts: Set up thresholds and receive instant alerts on threshold breaches, enabling quick response to potential problems.
Setup and configuration
- Site24x7 uses cross-tenancy access to monitor your resources using Site24x7's tenancy user. Log in to your Site24x7 account and create a specific policy to allow Site24x7 to view your resources without affecting your security.
- On the Integrate OCI Monitor page, select Internet Gateway from the Services to be discovered list.
Policies and permissions
Ensure that the associated OCI policy has the following statement:
- "read internet-gateway"
Polling frequency
Site24x7 queries OCI service-level APIs according to the set polling frequency (from once a minute to once a day) to collect metrics from the Internet Gateway monitor.
Supported metrics
These are the supported metrics for the Internet Gateway monitor:
| Metric name | Description | Statistics | Unit |
|---|---|---|---|
|
Bytes to Internet Gateway |
Number of bytes sent from OCI resources to the internet gateway for outbound internet traffic. |
Sum |
Bytes |
|
Bytes from Internet Gateway |
Number of bytes sent from the internet gateway to OCI resources for inbound internet traffic. |
Sum |
Bytes |
|
Packets to Internet Gateway |
Number of packets sent from OCI resources to the internet gateway for outbound internet communication. |
Sum |
Count |
|
Packets from Internet Gateway |
Number of packets sent from the internet gateway to OCI resources for inbound internet communication. |
Sum |
Count |
|
Packet Drops to Internet Gateway |
Total number of packets from OCI resources to the internet gateway that were dropped by the internet gateway due to various reasons. |
Sum |
Count |
|
Packet Drops from Internet Gateway |
Total number of packets from the internet gateway to OCI resources that were dropped due to various filtering or routing issues. |
Sum |
Count |
|
Packet Drops to IGW - Security Rule |
Number of packets dropped when going to the internet gateway due to security lists or network security group rules blocking the traffic. |
Sum |
Count |
|
Packet Drops to IGW - No Route |
Number of packets dropped when going to the internet gateway because no valid route was found in the route table for the destination. |
Sum |
Count |
|
Packet Drops to IGW - Throughput |
Number of packets dropped when going to the internet gateway due to throughput limits or bandwidth constraints being exceeded. |
Sum |
Count |
|
Packet Drops to IGW - Others |
Number of packets dropped when going to the internet gateway due to other miscellaneous reasons not covered by specific drop categories. |
Sum |
Count |
|
Packet Drops from IGW - Security Rule |
Number of packets dropped when coming from the internet gateway due to security list or network security group rules blocking the return traffic. |
Sum |
Count |
|
Packet Drops from IGW - No Route |
Number of packets dropped when coming from the internet gateway because no valid return route was found for the source. |
Sum |
Count |
|
Packet Drops from IGW - Throughput |
Number of packets dropped when coming from the internet gateway due to throughput limits or bandwidth constraints on the return path. |
Sum |
Count |
|
Packet Drops from IGW - Others |
Number of packets dropped when coming from the internet gateway due to other miscellaneous reasons not in specific drop categories. |
Sum |
Count |
|
Total Bytes |
Aggregated metric representing the total bytes processed (both to and from) by the internet gateway. Critical for understanding overall traffic volume. |
Sum |
Bytes |
|
Total Packets |
Aggregated count of all packets processed (both to and from) by the internet gateway. Essential for traffic pattern analysis. |
Sum |
Count |
|
Drop Rate |
Calculated percentage of packets dropped versus total packets processed. Key performance indicator showing the health and efficiency of the internet gateway. Values above 1–2% typically indicate infrastructure or configuration issues requiring immediate attention. |
Average |
Percentage |
Threshold configuration
To configure thresholds for the Internet Gateway monitor:
- Log in to your Site24x7 account and navigate to Admin > Configuration Profiles > Threshold and Availability.
- Click Add Threshold Profile.
- Select Internet Gateway from the Monitor Type drop-down menu and provide an appropriate name in the Display Name field.
- The supported metrics are displayed in the Threshold Configuration section. You can set threshold values for all the metrics mentioned above.
- Click Save.
Licensing
- Each Internet Gateway monitor utilizes one basic monitor license.
Viewing internet gateway data
To monitor your internet gateway environment, log in to your Site24x7 account and navigate to Cloud > OCI > Internet Gateway.
Monitor data
The monitor data for the Internet Gateway monitor is given below.
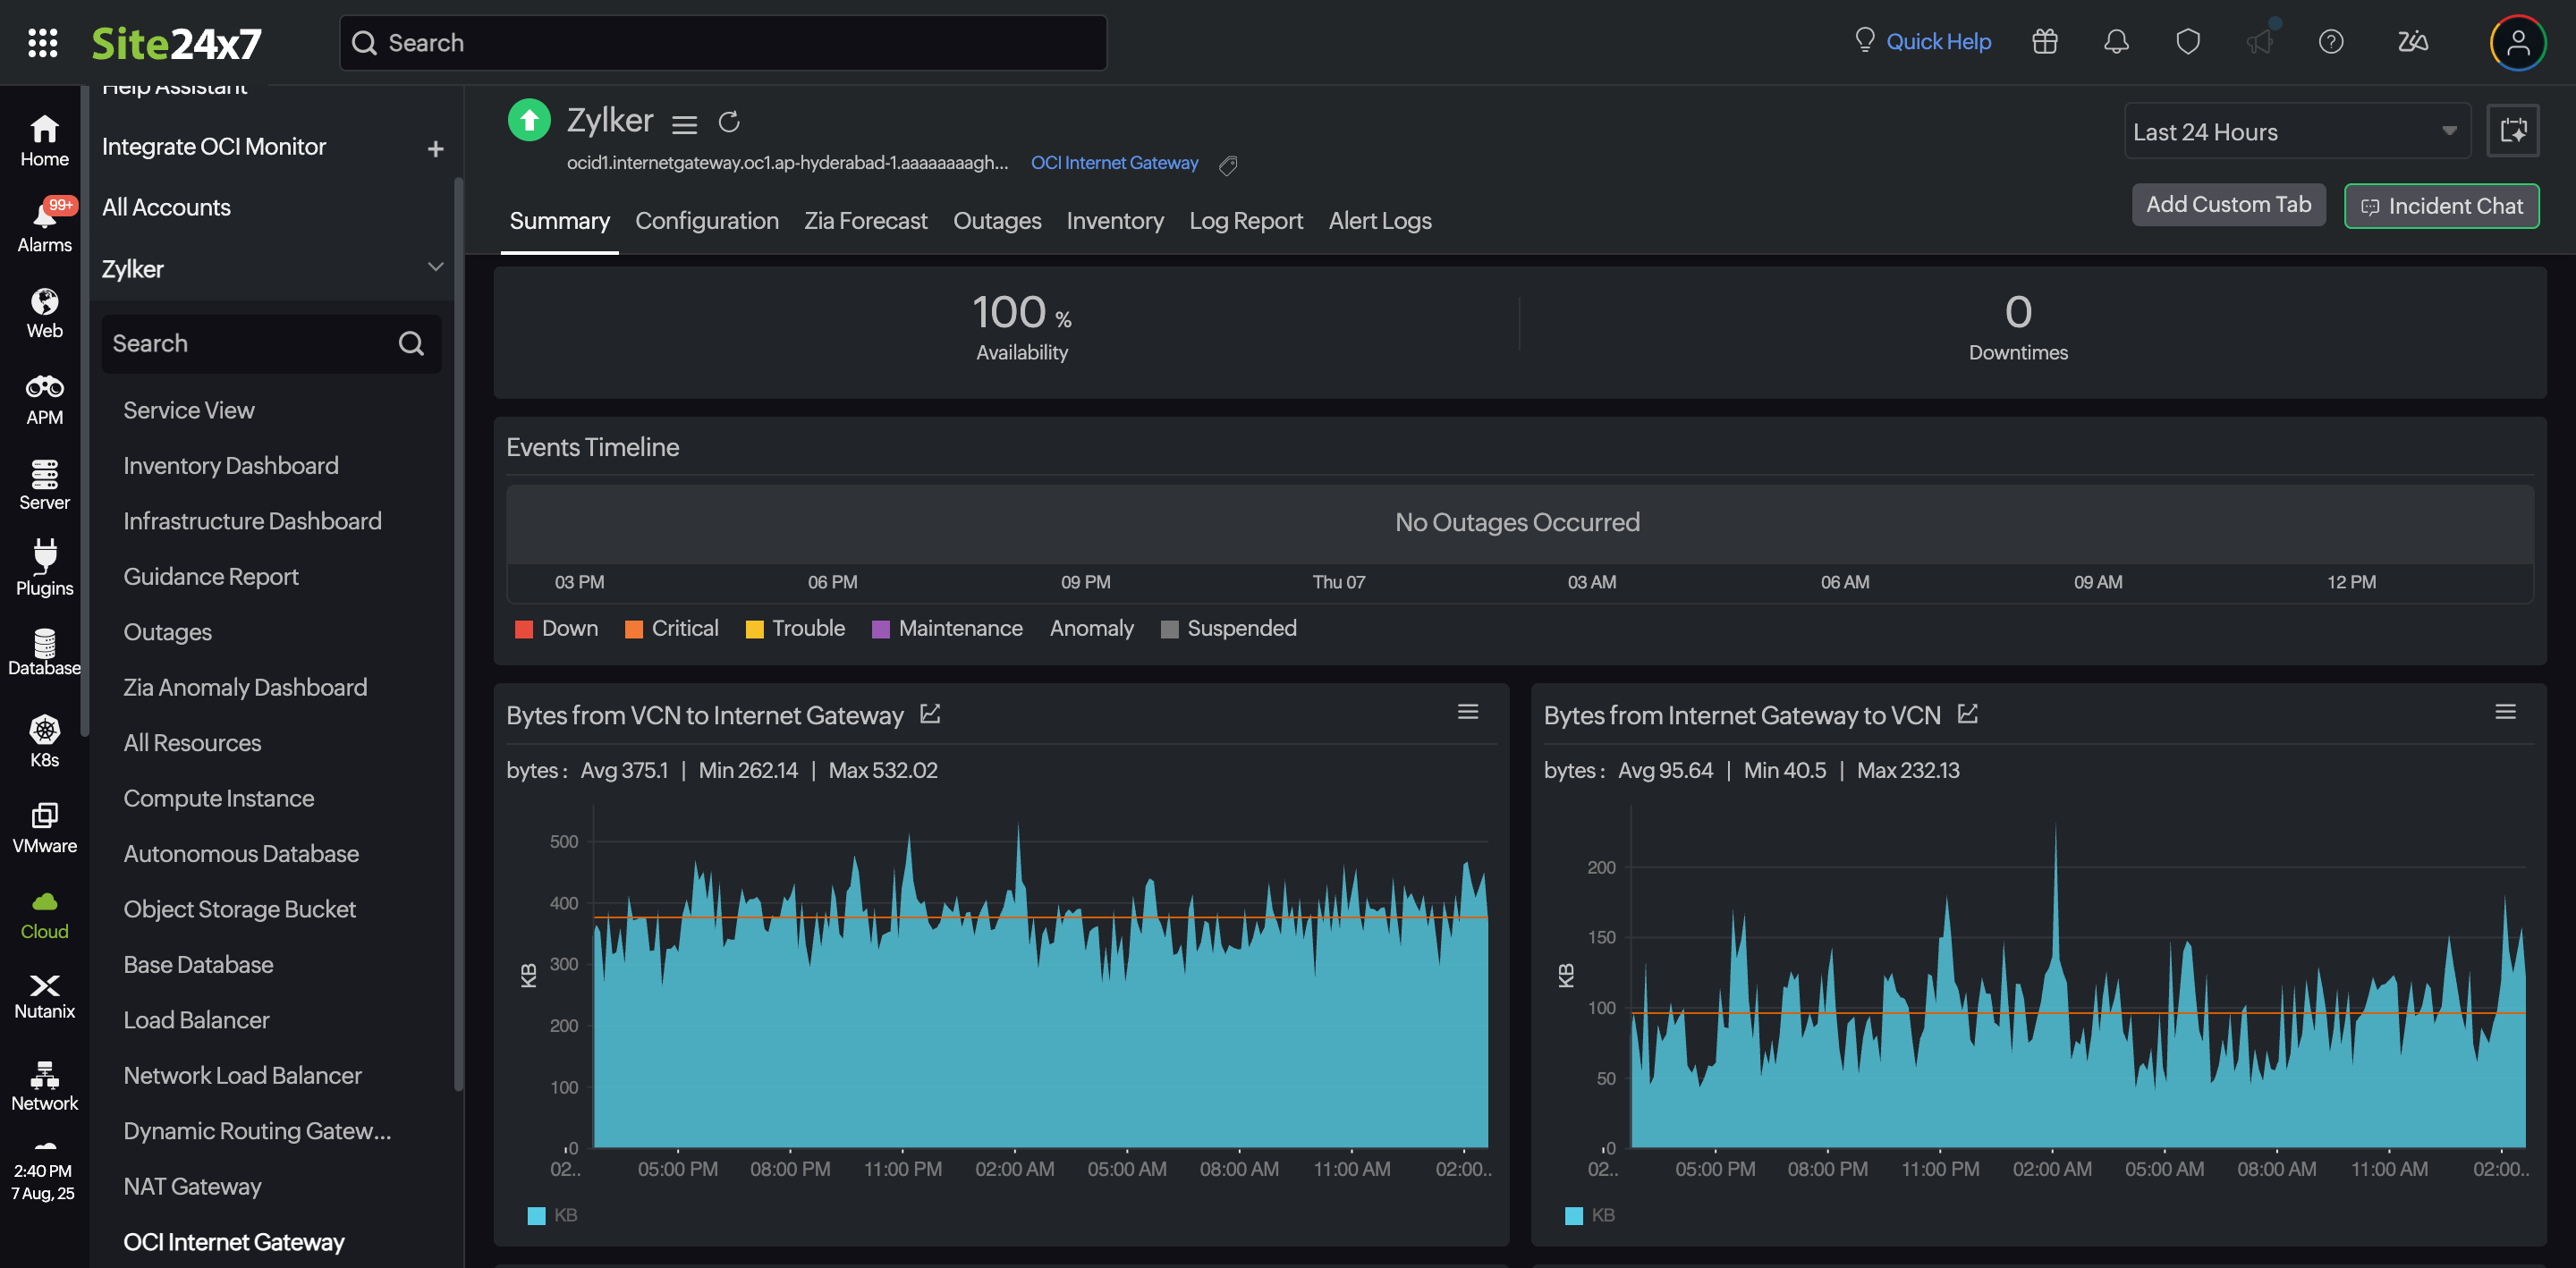
Summary
The Summary tab offers a comprehensive overview of the events timeline and metrics, presenting insightful charts that shed light on the performance of the Internet Gateway monitor.
Configuration
The Configuration tab summarizes essential details of the Internet Gateway monitor, including its Created Time, State, and other configuration details.
Zia Forecast
The Zia Forecast tab displays the forecast chart with future points of a performance metric (measurement of resource usage) based on historical time series data. Fifteen days of historical data is used to predict what your metric usage will be in the next seven days.
Outages
The Outages tab provides details on an outage's Start Time, End Time, Duration, and Comments (if any).
Inventory
Obtain details like Type, Region, Monitor Licensing Category, and much more from the Inventory tab. The Threshold and Availability Profile and the Notification Profile can be set according to the user and viewed in this tab.
Log Report
The Log Report tab offers a consolidated report of the Internet Gateway monitor's log status, which can be downloaded as a CSV file.
Alert Logs
The Alert Logs tab displays a chronological list of all triggered alerts related to the Internet Gateway monitor. This tab helps you trace alert history and severity to assess issues and validate threshold settings.