Azure NetApp Files Capacity Pool Monitoring Integration
Azure NetApp Files is an elevated, regulated file storage service that enables you to store and manage your data more reliably.
With Site24x7's integration, you can now monitor your Azure NetApp Files capacity pools with accurate metrics, configure thresholds, and get instant alerts if there is a breach.
Setup and configuration
- Adding Azure NetApp Files capacity pool while configuring a new Azure monitor
If you haven't configured an Azure monitor yet, add one by following the steps below:
- Log in to your Site24x7 account.
- Go to Cloud > Azure > Add Azure Monitor. You can also follow these steps to add an Azure monitor.
- During Azure monitor configuration, on the Edit Azure Monitor page, select Azure NetApp Files capacity pool from the Service/Resource Types drop-down.
- Adding an Azure NetApp Files capacity pool while configuring a existing Azure monitor
If you already have an Azure monitor configured for the tenant, you can add the Azure NetApp Files capacity pool by following the steps below:
- Log in to your Site24x7 account.
- Go to Cloud > Azure, select your Azure monitor, then go to any of the dashboards on the left pane of your Azure monitor.
- Click the hamburger
 icon and select Edit, which brings you to the Edit Azure Monitor page.
 - On the Edit Azure Monitor page, select the corresponding Subscriptions and Resource Groups from the drop-downs, select Azure NetApp Files Capacity Pool from the Service/Resource Types drop-down, and click Save.
- After successful configuration, go to Cloud > Azure > Azure NetApp Files Capacity Pool. Now you can view the discovered Azure NetApp Files capacity pools.
It will take 15-30 minutes to discover new Azure resources. For immediate discovery of the selected configuration, click the Infrastructure Dashboard of the Azure monitor, hover over the hamburger icon ![]() , and select Discover Now.
, and select Discover Now.
Polling frequency
Site24x7's Azure NetApp Files capacity pool monitor collects metrics data every minute and the statuses of your Azure NetApp Files capacity pools every five minutes.
Supported metrics
| Metric name | Description | Statistic | Unit |
|---|---|---|---|
| Pool Allocated Size | The provisioned size of this pool | Average | Bytes |
| Pool Allocated Throughput | The average sum of the throughput of all the volumes belonging to the pool | Average | Bytes per second |
| Pool Allocated to Volume Size | The allocated used size of the pool | Average | Bytes |
| Provisioned Throughput for the Pool | The provisioned throughput of this pool | Average | Bytes per second |
| Pool Consumed Size | The sum of the logical sizes of all volumes belonging to the pool | Average | Bytes |
| Total Snapshot Size for the Pool | The sum of the snapshot sizes of all volumes in this pool | Average | Bytes |
Threshold configuration
Global configuration
- In the Site24x7 web client, go to the Admin section on the left navigation pane.
- Select Configuration Profiles from the left pane and select Threshold and Availability from the drop-down.
- Click Add Threshold Profile in the top-right corner.
- For Monitor Type, select Azure NetApp Files Capacity Pool.
Now you can set the threshold values for all the metrics listed above.
Monitor-level configuration
- In the Site24x7 web client, go to Cloud > Azure > Azure NetApp Files Capacity Pool.
- Select a resource you would like to set a threshold for, then click the hamburger
 icon .
 - Select Edit, which directs you to the Edit Azure NetApp Files Capacity Pool Monitor page.
- You can set the threshold values for the metrics with the Threshold and Availability option.
You can also configure IT Automation at the attribute level.
IT Automation
Site24x7 offers a set of exclusive IT Automation tools that automatically resolve performance degradation issues. These tools react to events proactively rather than waiting for manual intervention. The IT Automation tools automate repetitive tasks and automatically remediate threshold breaches. The alarm engine continually evaluates system events for which thresholds are set and executes the mapped automation when there is a breach.
How to configure IT Automation for a monitor
Configuration Rules
Editing multiple monitors to associate different monitor groups or add a different tag can be a tedious process. With Site24x7's Configuration Rules, you can automate the configuration settings of your monitoring resources. Also, Site24x7 allows you to create custom rules to track configuration changes continuously and achieve the ideal configuration settings.
How to add Configuration Rules
Summary
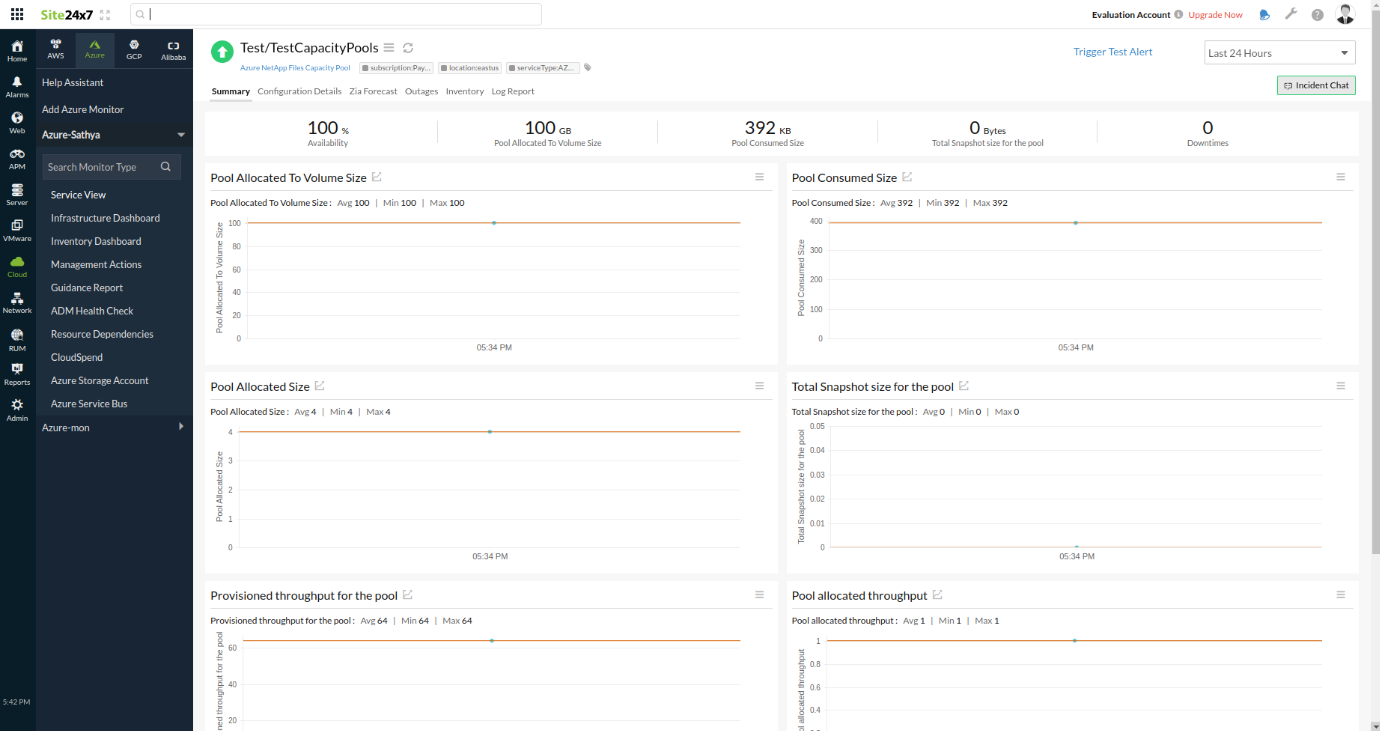
The Summary tab will give you the performance data organized by time for the metrics listed above. To view the summary:
- Go to Cloud > Azure > Azure NetApp Files Capacity Pool.
- Select a resource.
- Click the Summary tab. By doing so, you can view metrics like Pool Allocated Size, Pool Allocated Throughput, and Pool Consumed Size.
Configuration Details
The Configuration Details tab provides details on the configurations of application instances. Here, you can find the Azure NetApp Files Capacity Pool ID in which the Pool Id, Service Level, Size, QOS Type, and more. To get the configuration details:
- Go to Cloud > Azure > Azure NetApp Files Capacity Pool.
- Select a resource.
- Click the Configuration Details tab.
Reports
Gain in-depth data about the various parameters of your monitored resources and accentuate your service performance using our insightful reports.
To view reports for an Azure NetApp Files capacity pool:
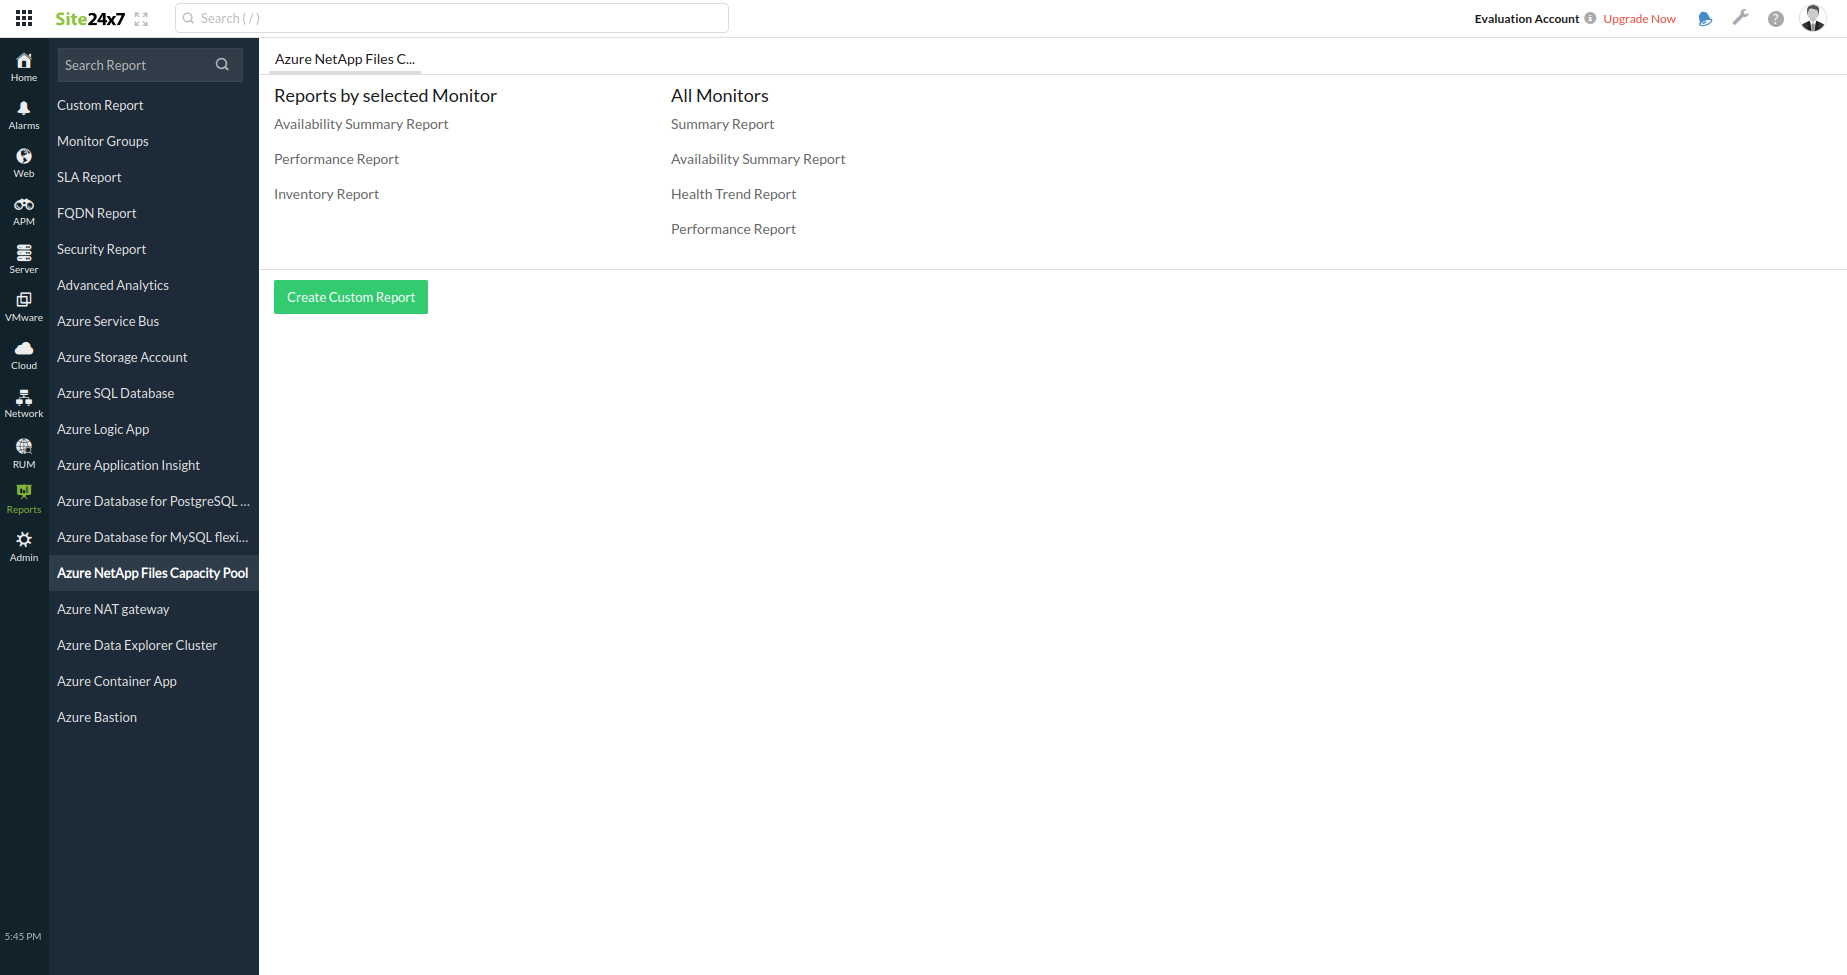
- Go to the Reports section on the left navigation pane.
- Select Azure NetApp Files Capacity Pool from the menu on the left.
You can find the Availability Summary Report, Performance Report, and Inventory Report for one selected monitor. Or you can get the Summary Report, Availability Summary Report, Health Trend Report, and Performance Report for all the Azure NetApp Files capacity pool monitors.

You can also get reports from the Summary tab of the Azure NetApp Files capacity pool monitor:
- Click the Summary tab.
- Get the Availability Summary Report of the monitor by clicking Availability.
- You can also find the Performance Report of the monitor by clicking any chart title.

