Metrics of OpenTelemetry
Site24x7 OpenTelemetry metrics deliver comprehensive system and application performance visibility by capturing telemetry from detailed measurements and event counts. Advanced query customization and aggregation empower users to analyze performance patterns and extract real-time, actionable insights.
The metrics interface features intuitive tabs like Explorer and Summary that enable in-depth data exploration, trend analysis, and seamless export to custom dashboards, providing a unified and efficient framework for performance monitoring and reporting.
Explorer tab
The Explorer view provides a drop-down query builder that generates graphs for your telemetry metrics. The updated graph displays a single- or multi-line chart, showcasing real-time visualizations of system and application performance. The resulting dashboards can be used to turn raw telemetry data into actionable insights that allow you to spot trends quickly and correlate them without writing manual queries.
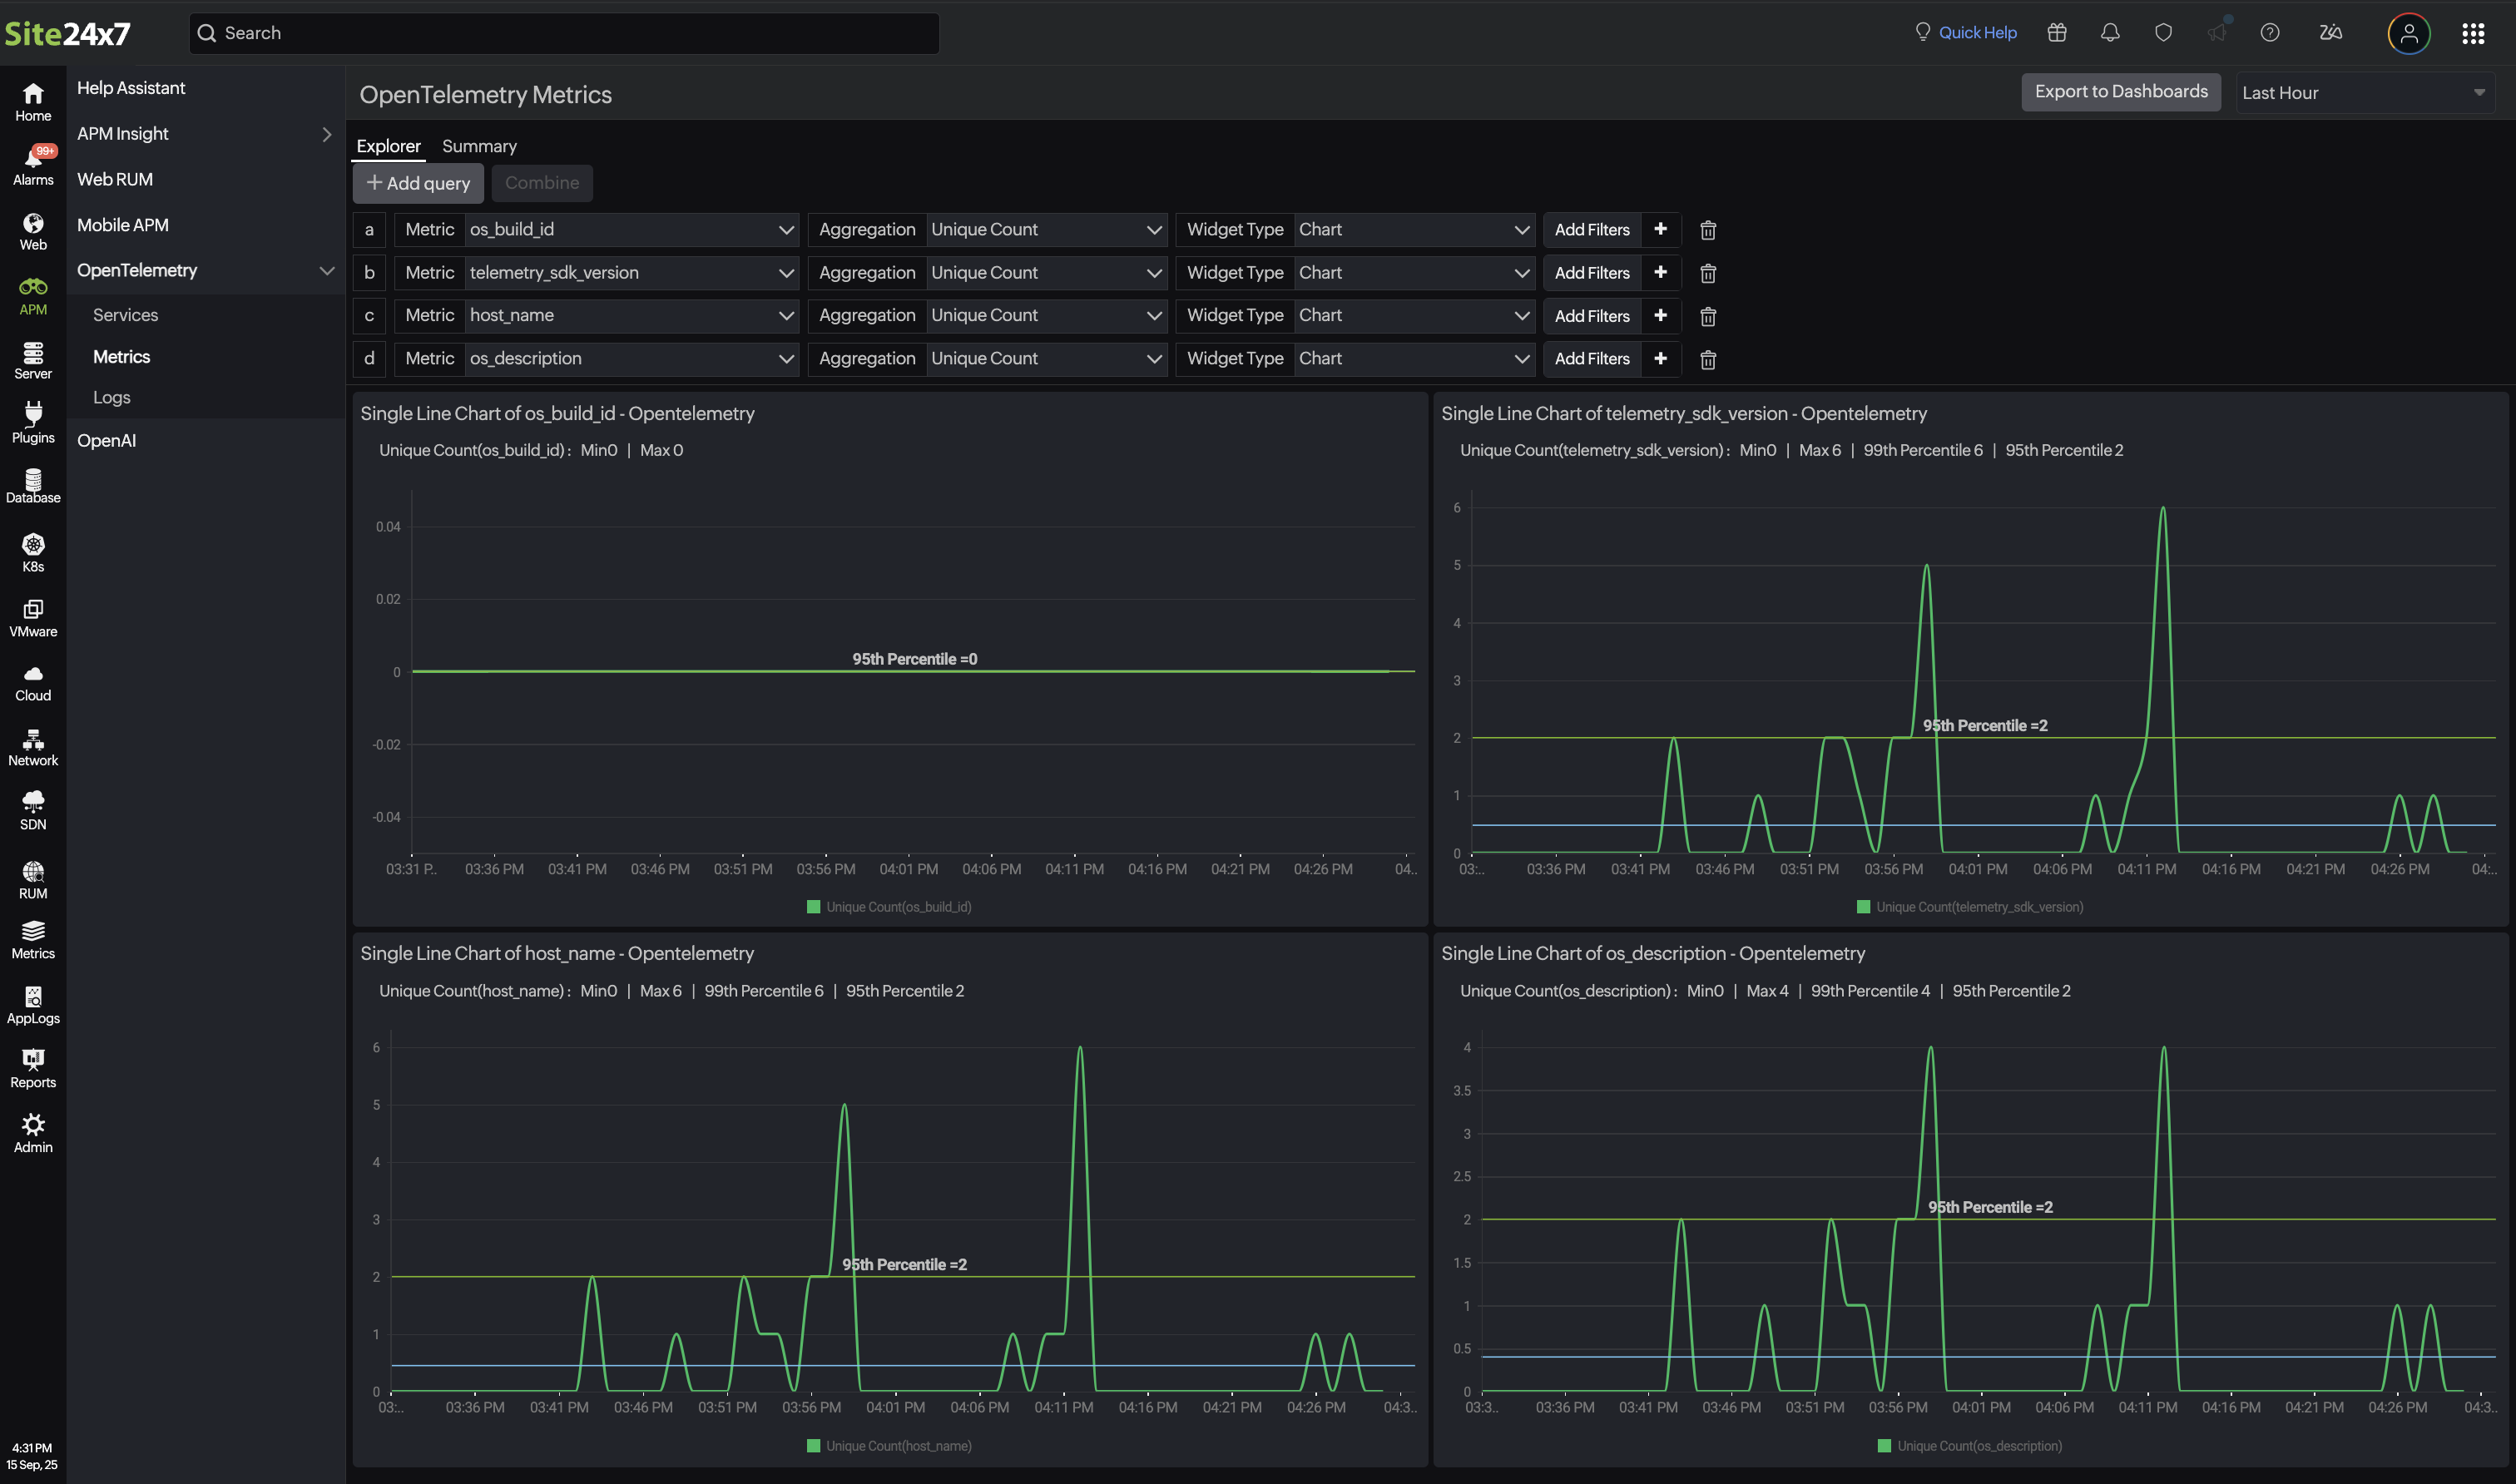
Add Query
The Add Query button enables the creation of customized queries to retrieve or analyze a specific metric.
- On clicking this, a tailored query-based graph is generated using the selected metrics, aggregation type, and widget type.
- The resulting data is then visually represented either as a single-line or a multi-line chart, depending on the complexity and number of queries added, facilitating a clear and focused performance analysis.
| Parameters | Description |
|---|---|
| Metrics | Select the servers, applications, websites, and network name that you wish to include in your query. |
| Aggregation | Based on the selected metrics, choose string or numeric aggregation methods.
|
| Widget Type | Choose either a chart or numeric display to meet your analysis and reporting needs. |
Add Filters: Click the plus icon + beside Add Filters to add more filters based on tags.
Based on your needs, you can select the time period in the top-right corner of the page. By default, the time period is set to Last Hour, and you can select periods of up to one month.
Once you have added the parameters, the system will generate and display the data visually in the corresponding charts:
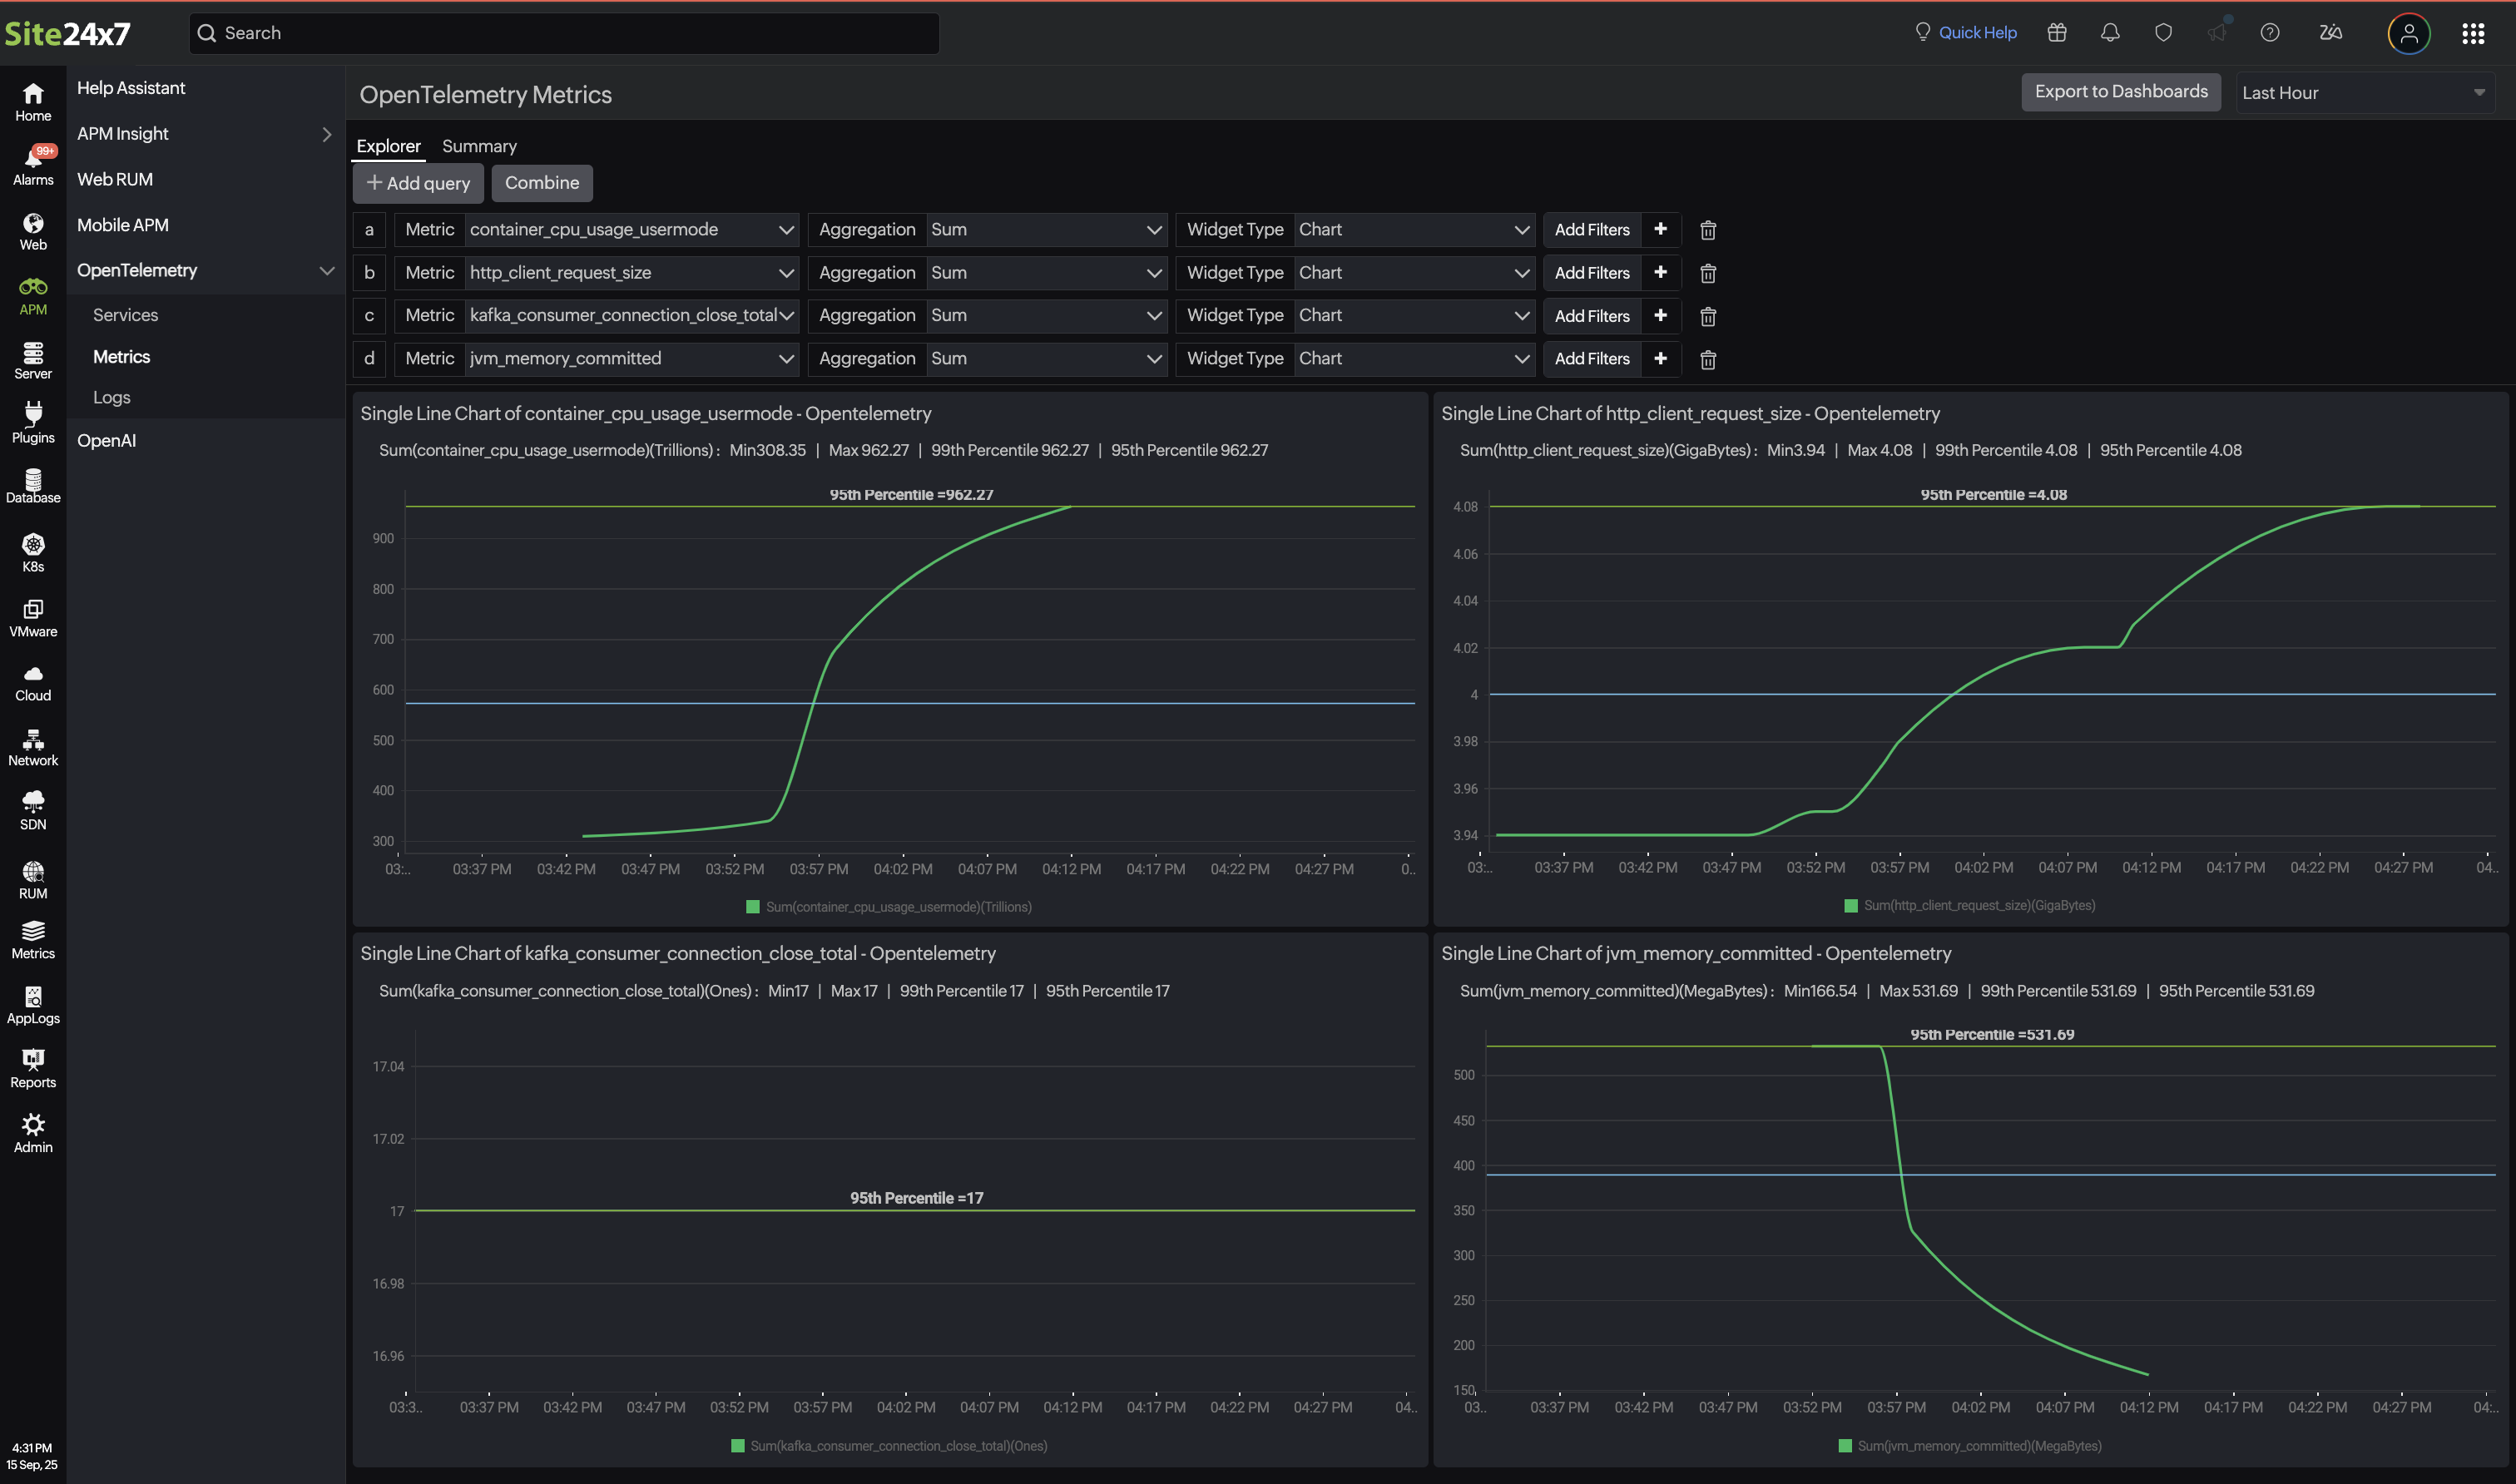
Single-line chart:
Displays a line chart for a single line of query.
Multi-line chart:
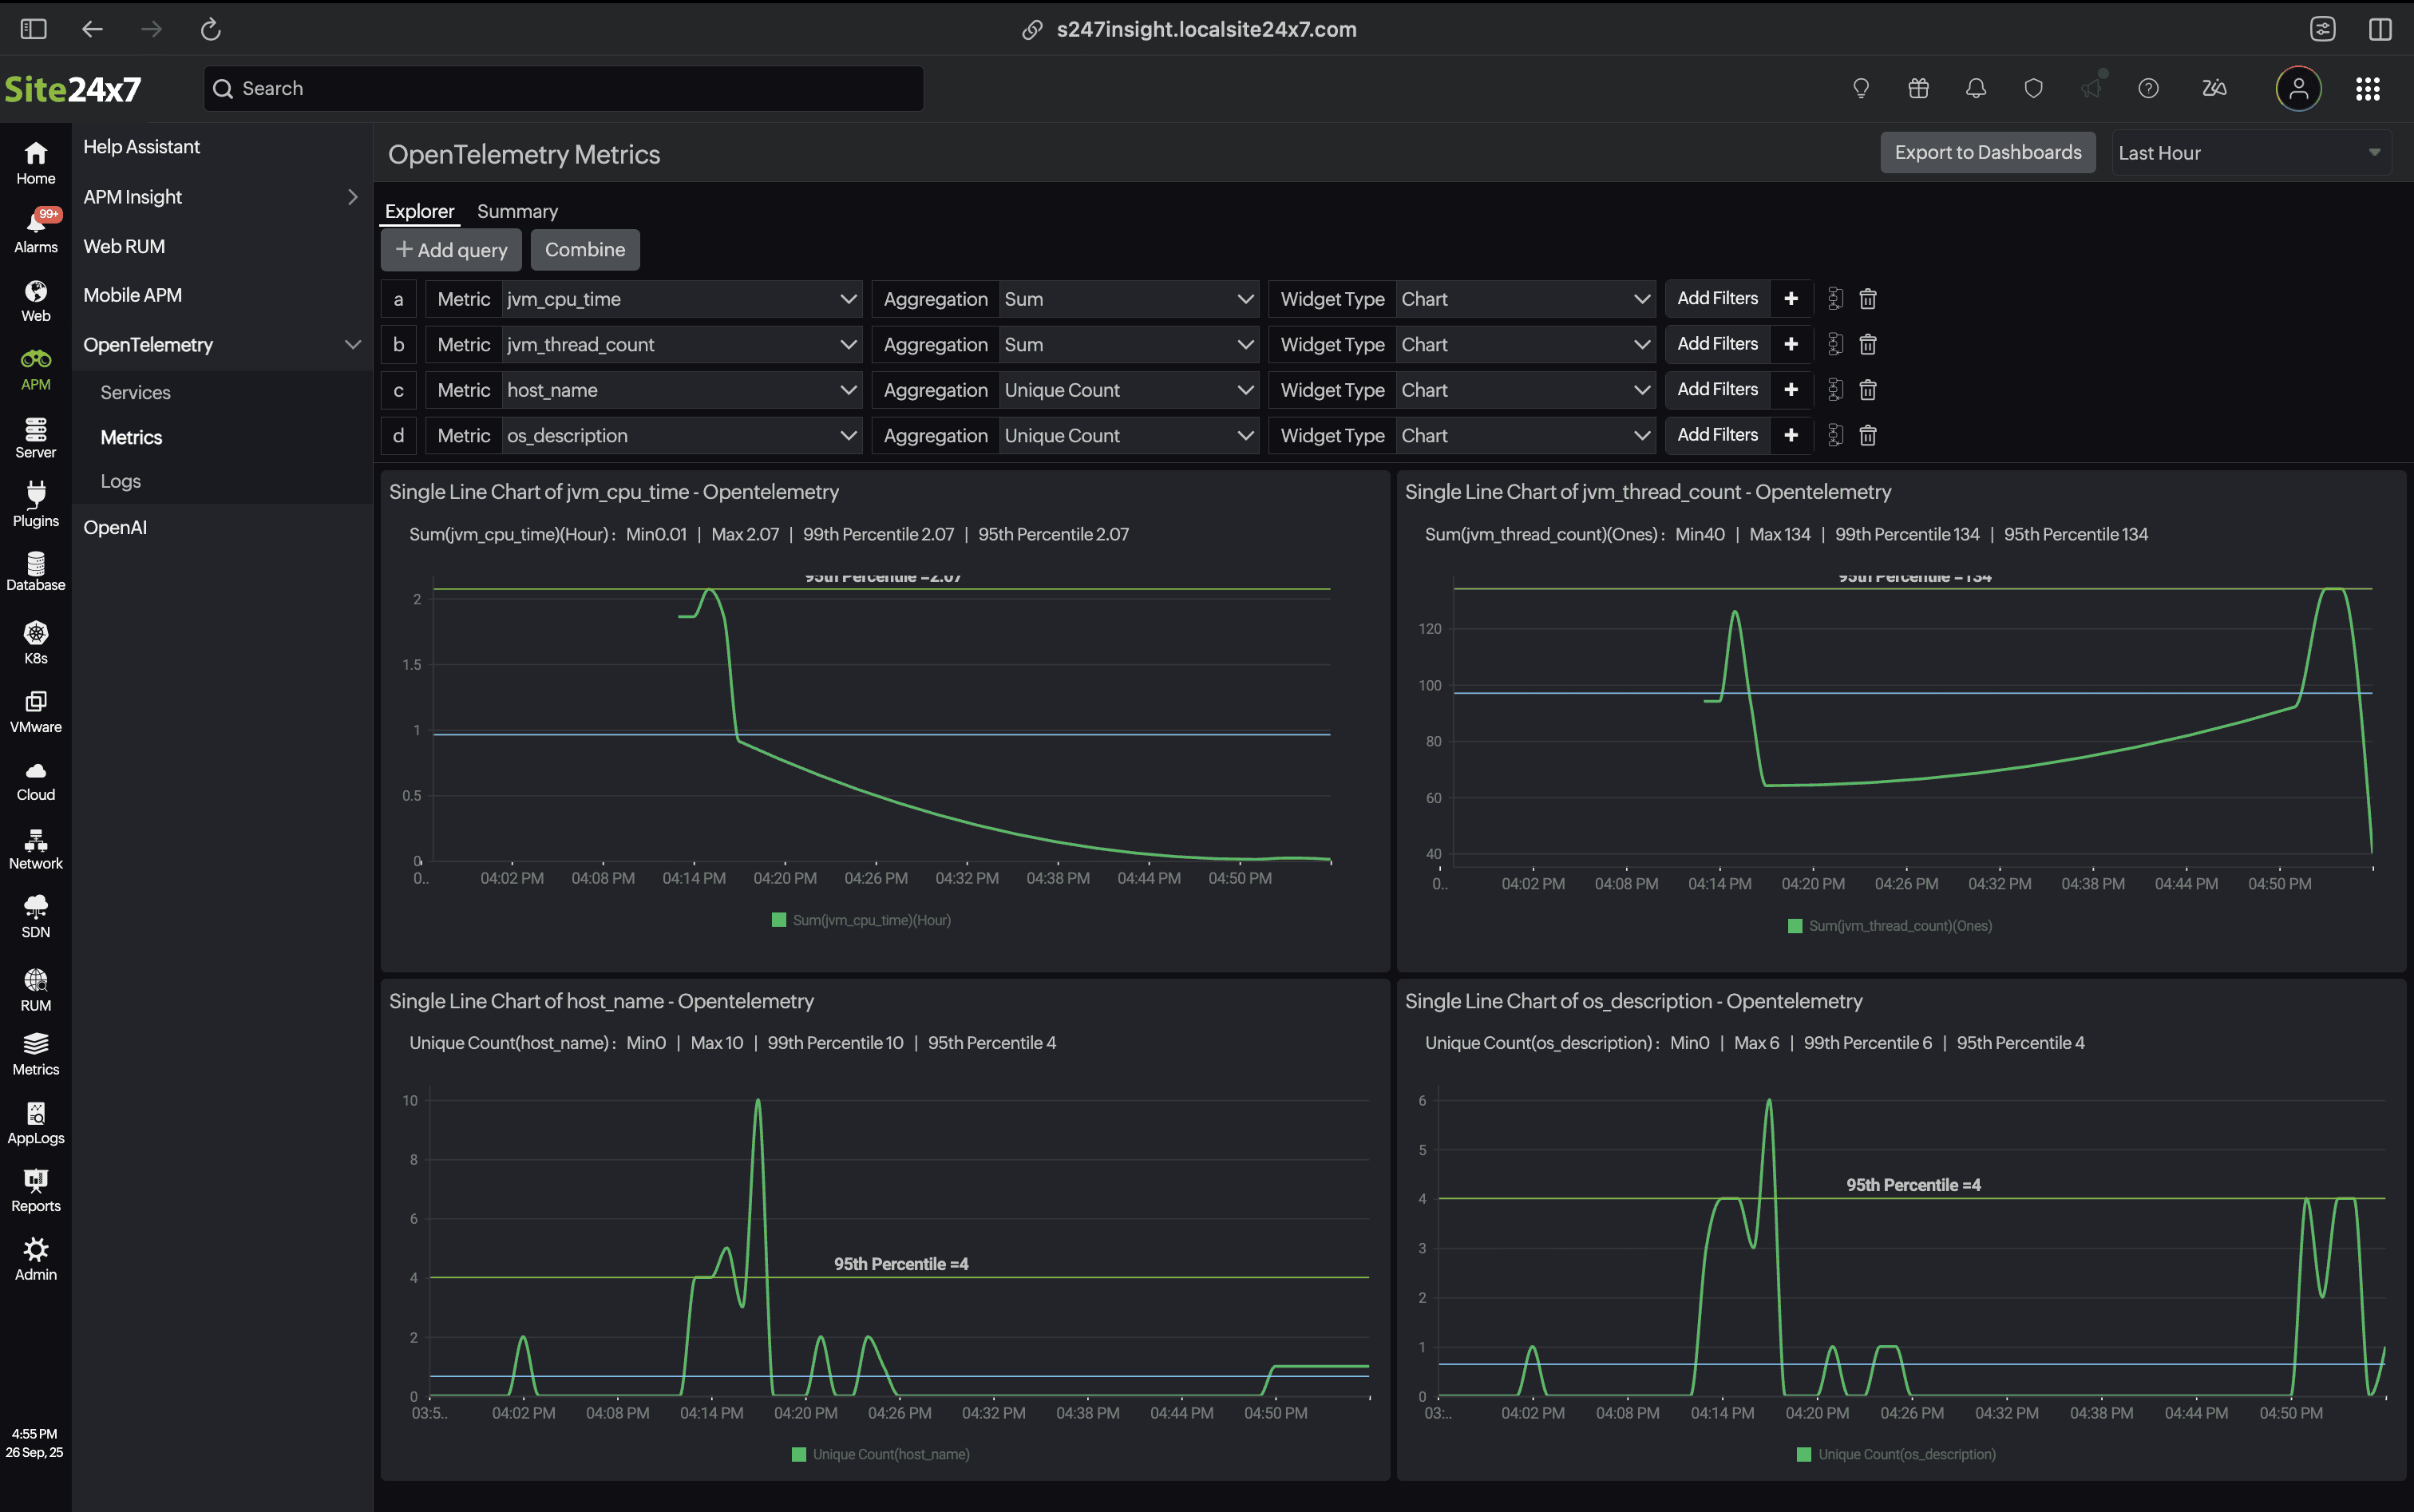
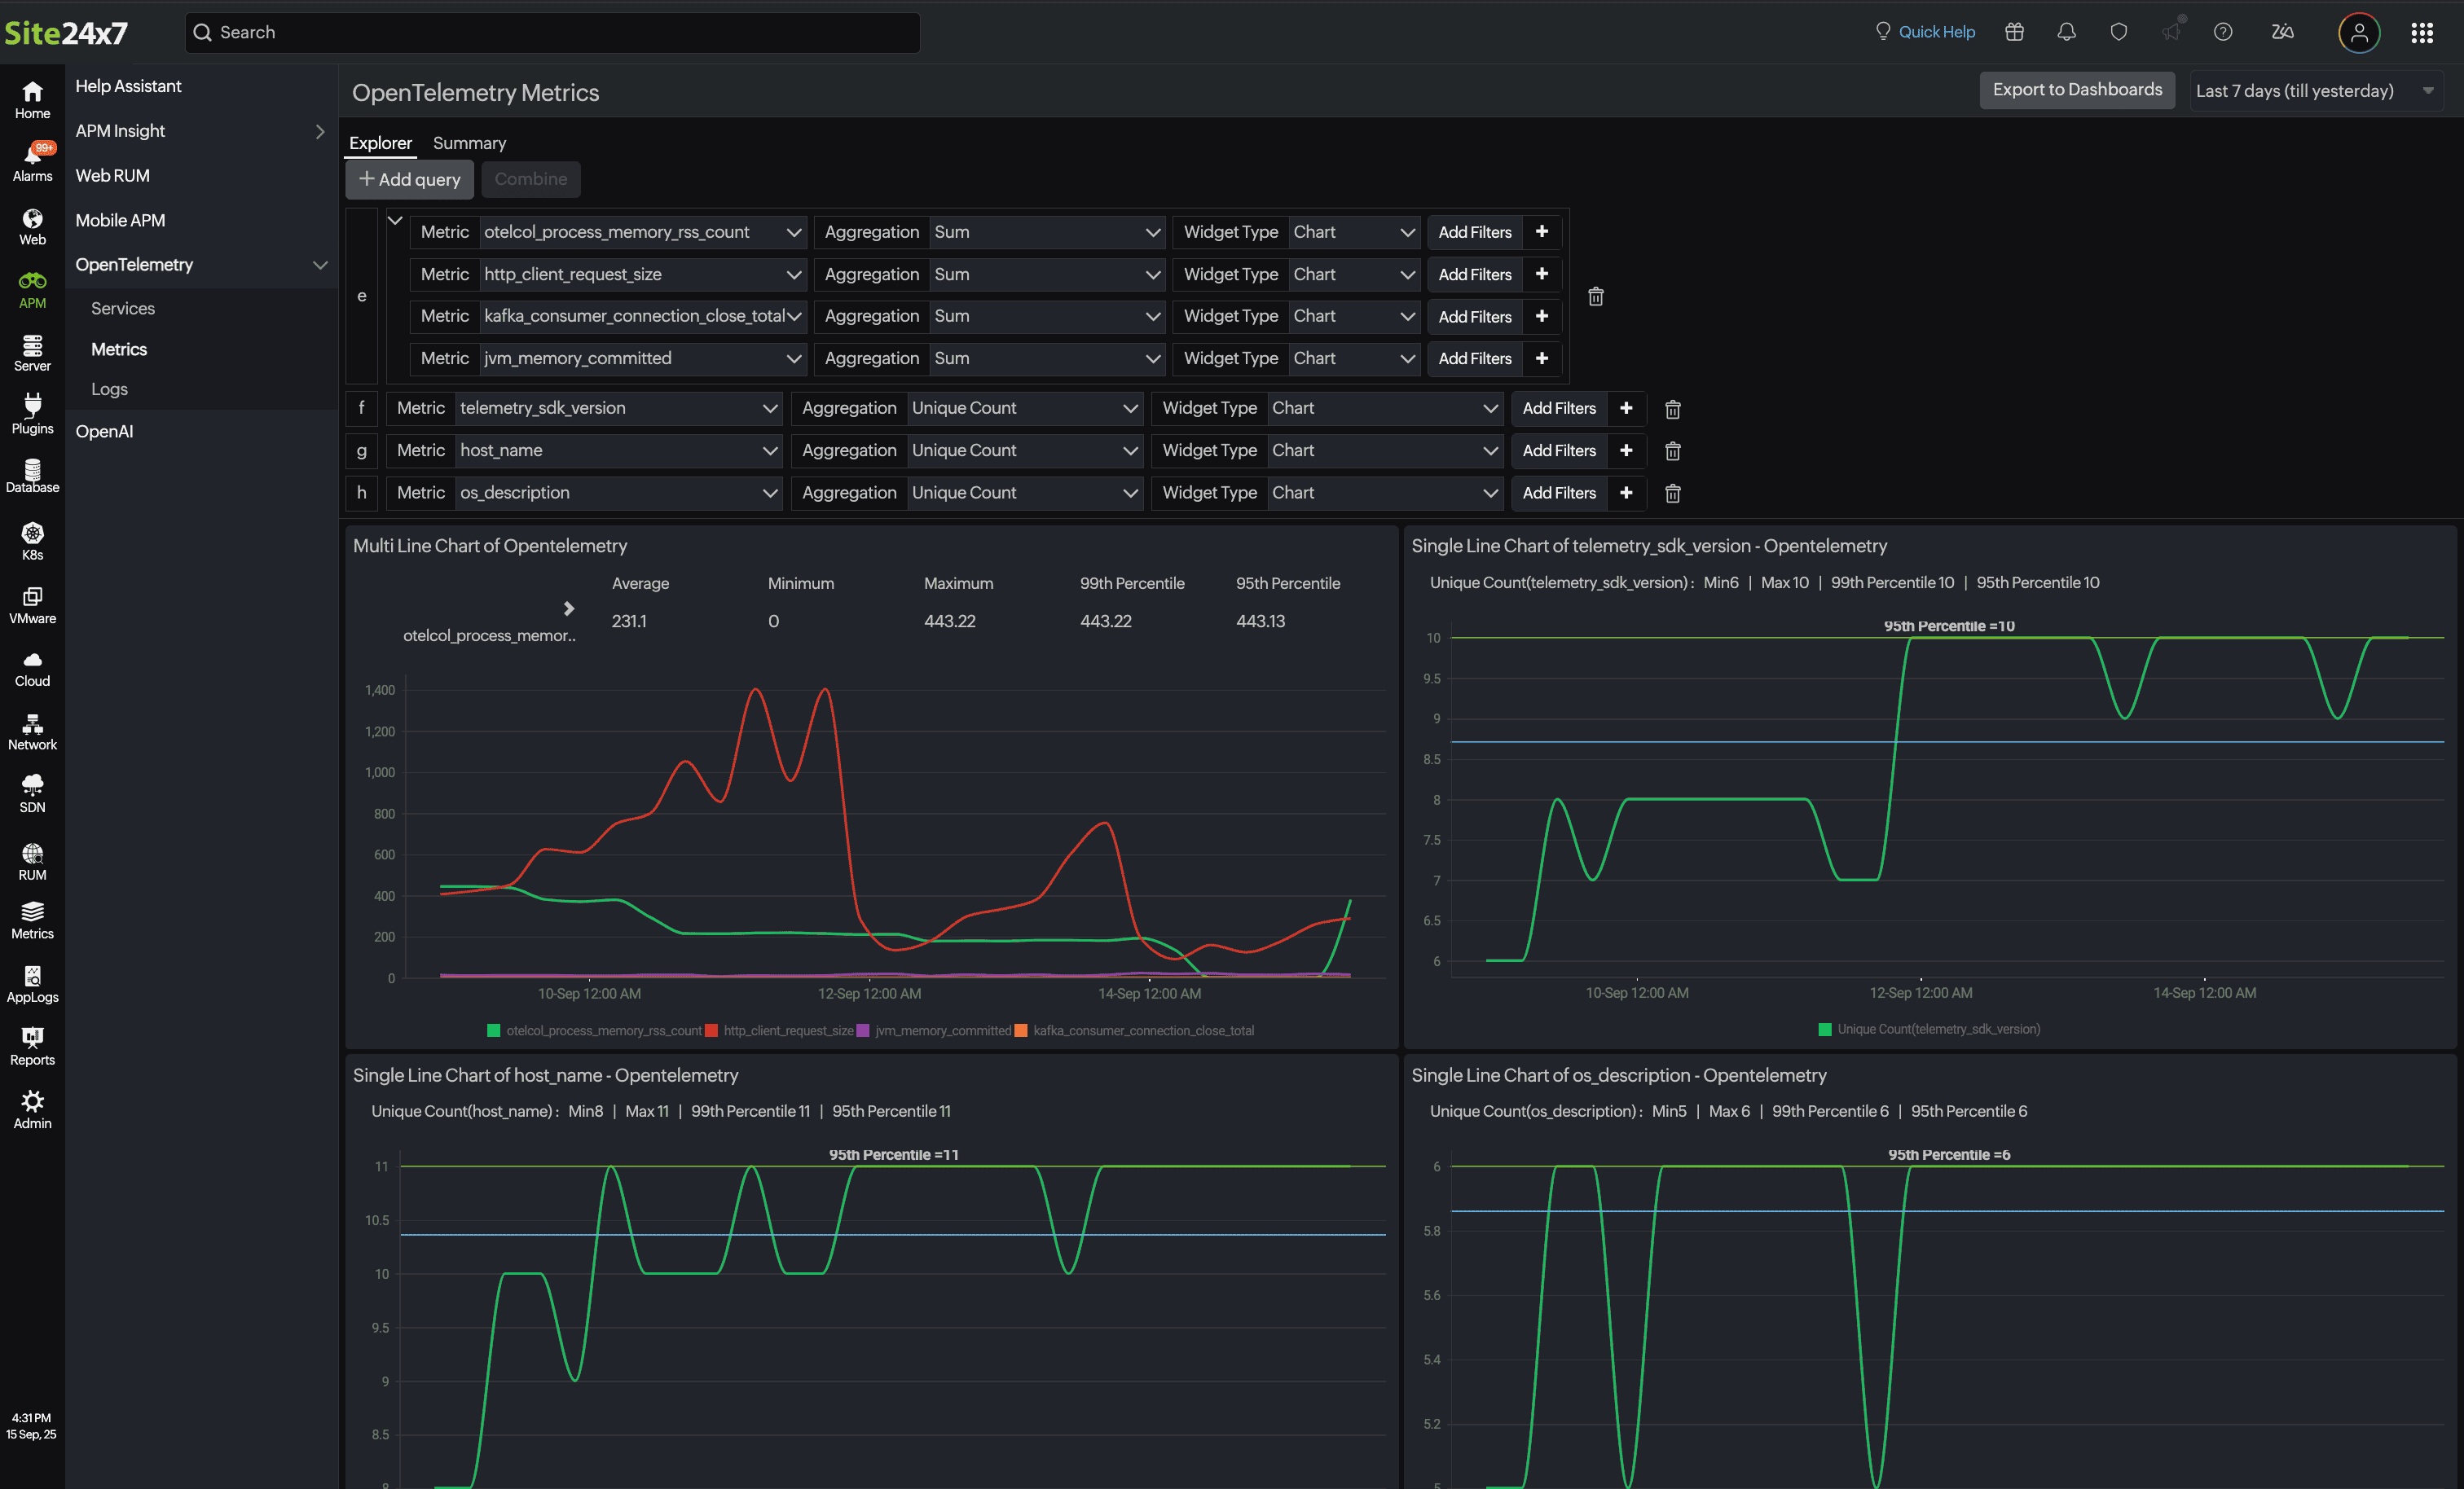
Click the Add Query button to apply additional filters. When multiple numeric aggregations are present, the Combine button becomes available, merging them into a multi-line chart that visualizes data trends based on the selected filter criteria.
Export to dashboard
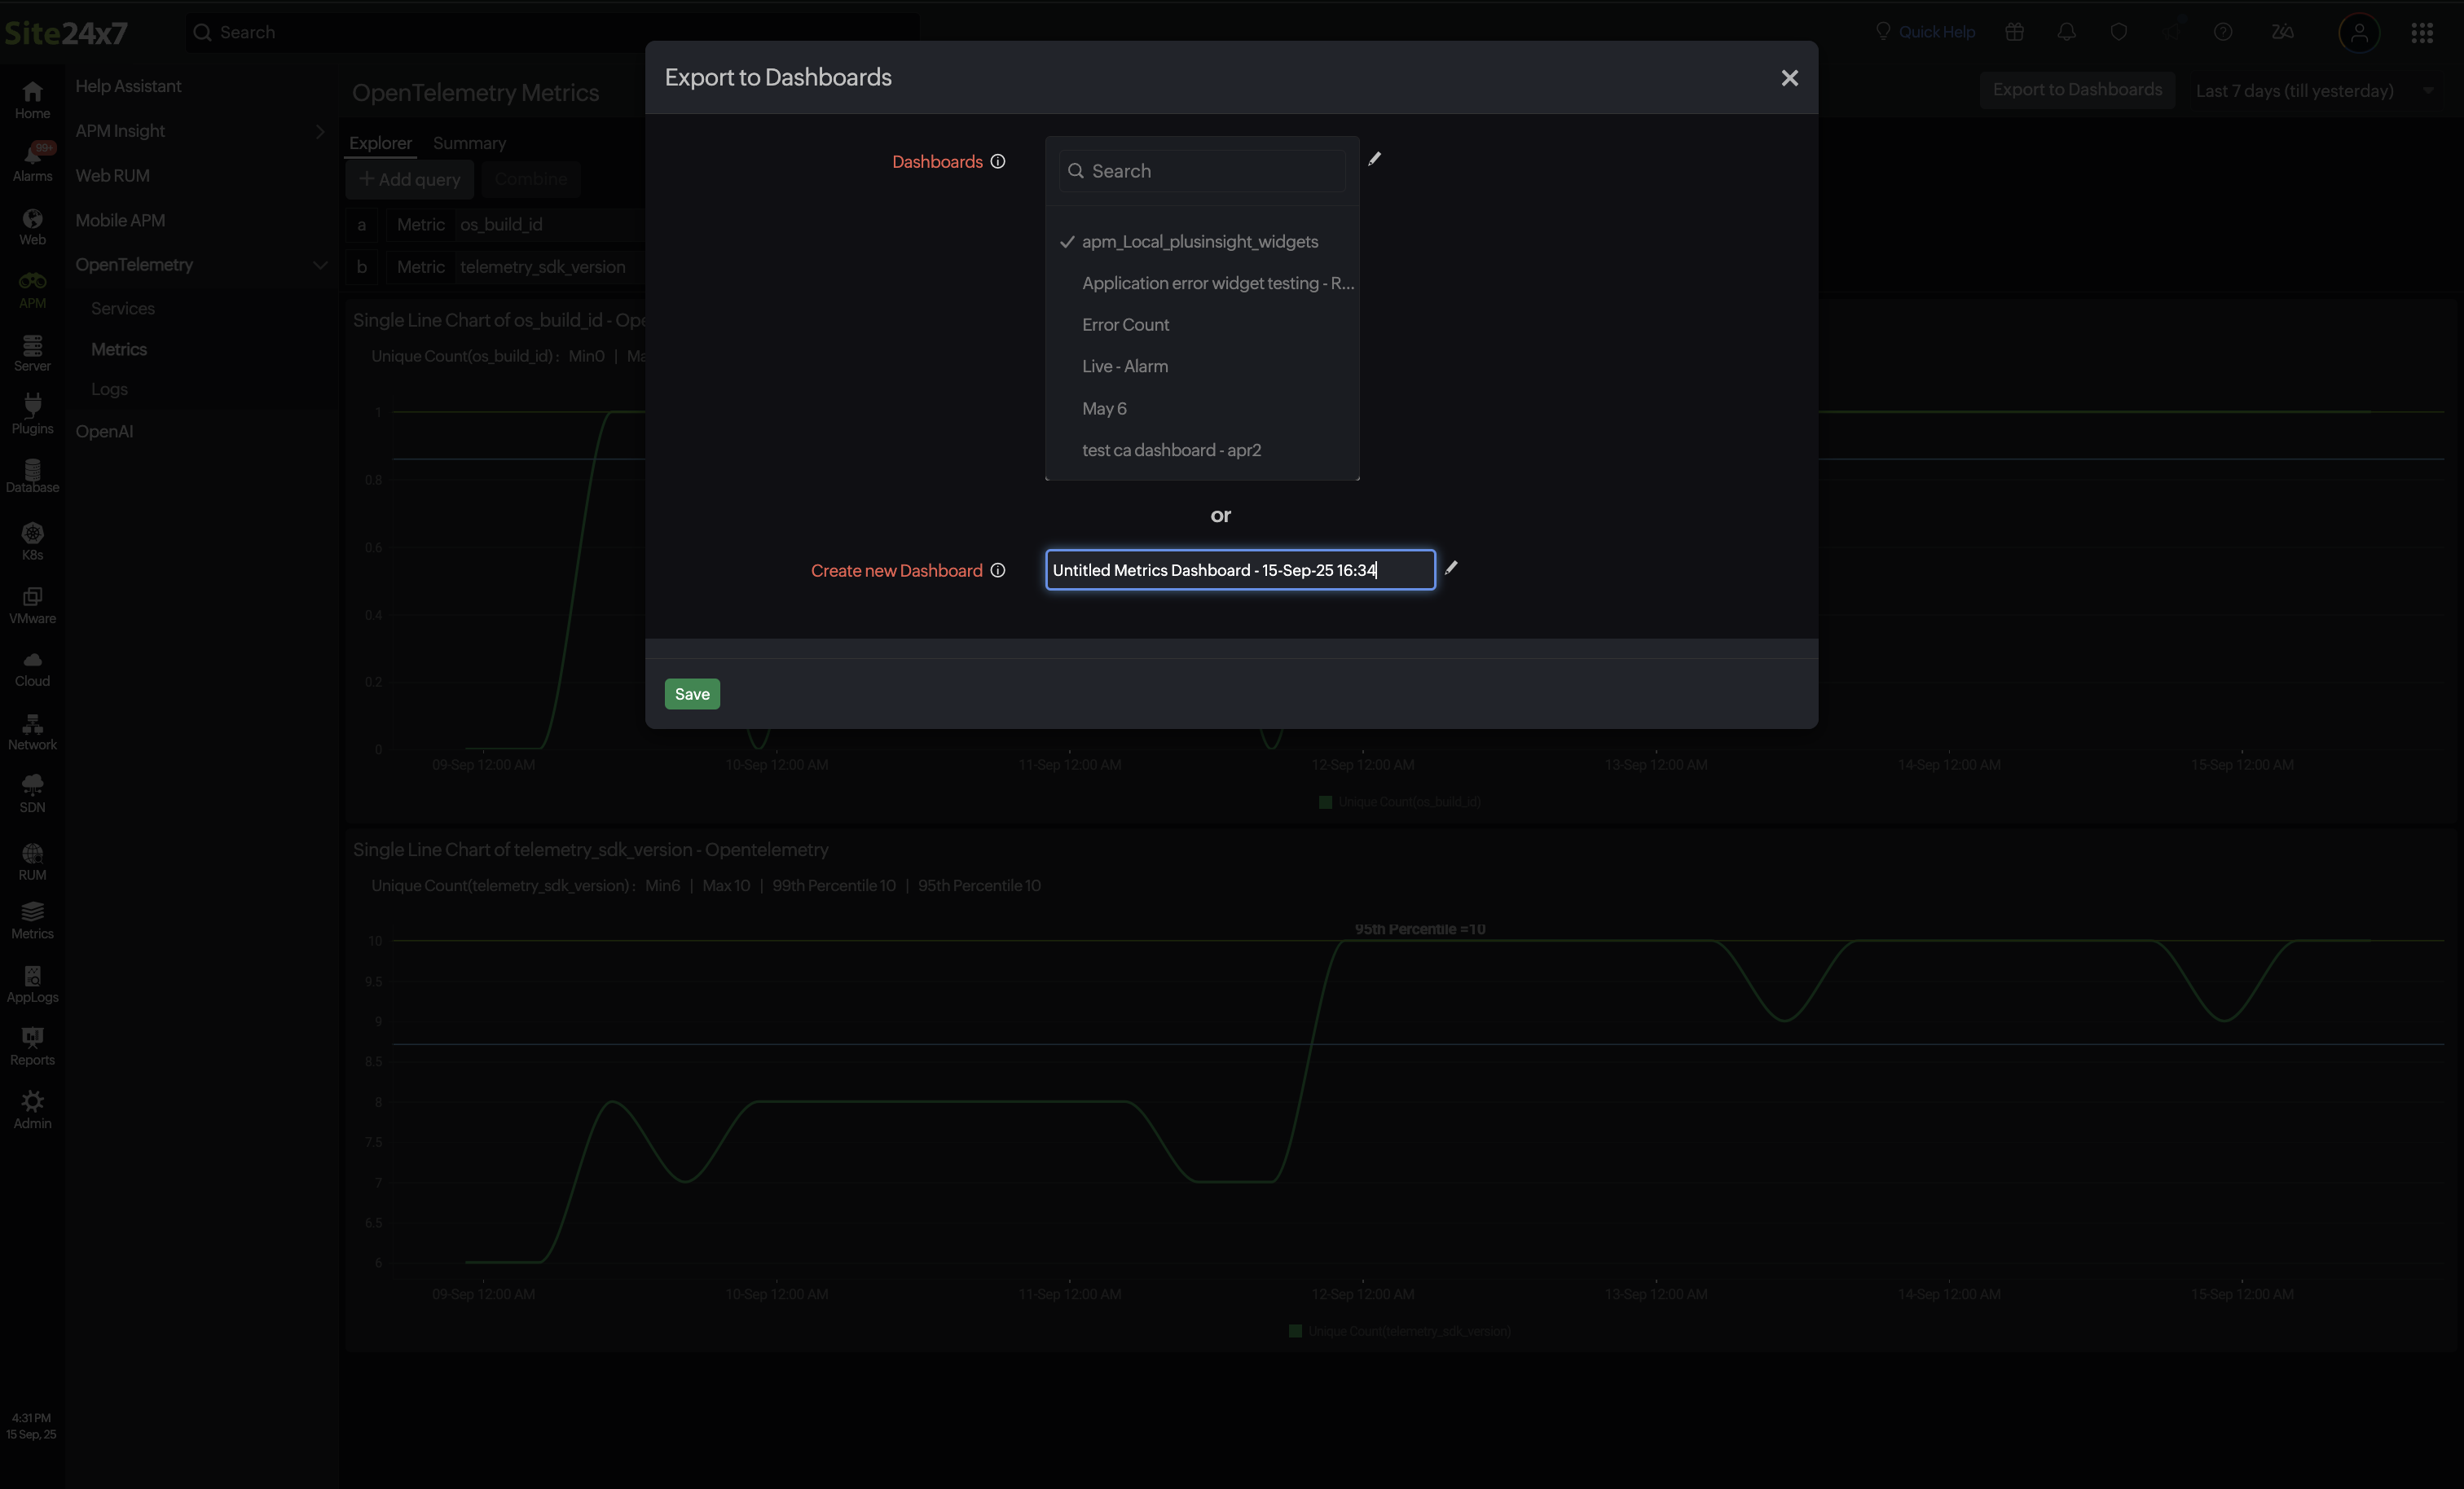
By clicking the Export to Dashboards button, you can add the newly created metrics to an existing dashboard or create a new dashboard by providing a name in the Create New Dashboard field.
Summary
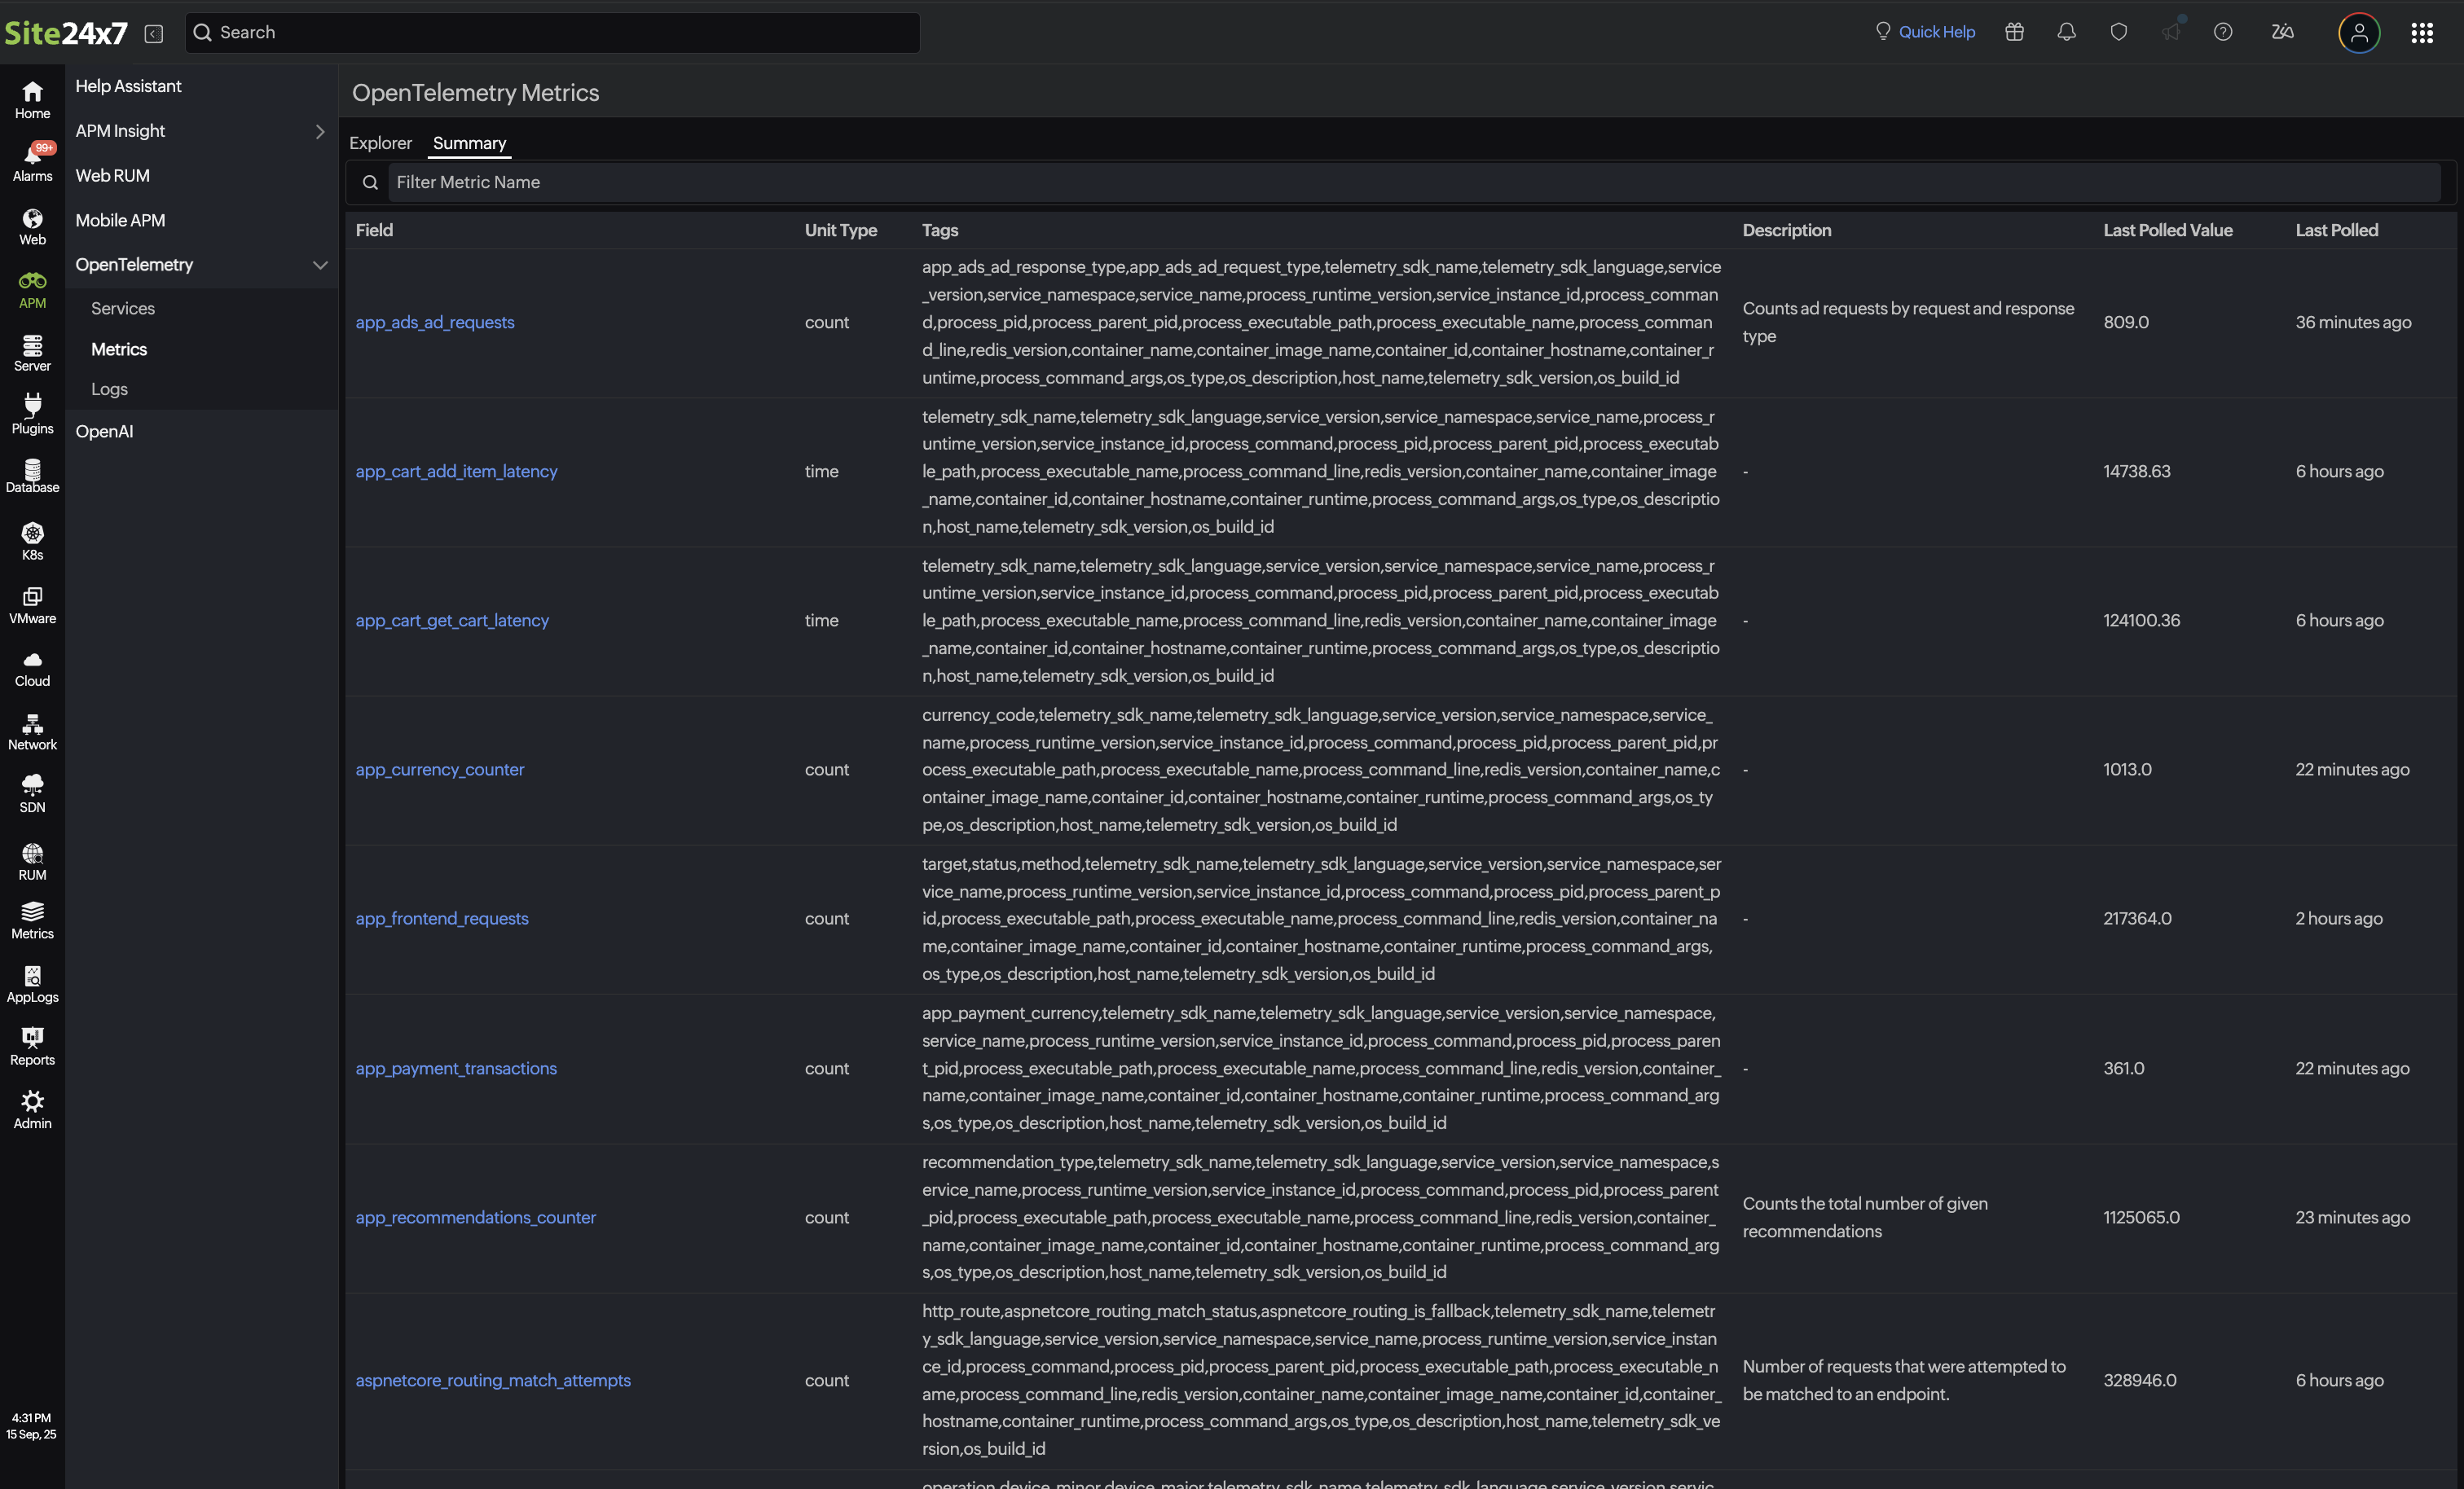
The Summary tab provides an overview of all the OpenTelemetry metrics collected in your environment. This consolidated view makes it easy to monitor, search, and understand key performance indicators by listing the essential details for each metric.
| Parameters | Description |
|---|---|
| Field | Displays the name of the metrics being monitored, such as counts and latency events. |
| Unit Type | Displays metrics based on the type of unit measured. |
| Tags | Displays the list of attributes or labels associated with the metrics, aiding in metric filtering and segmentation. |
| Description | Displays a summary of what the metrics represent. |
| Last Polled Value | Displays the most recent value collected for the metrics. |
| Last Polled | Displays the timestamp since the metrics were last polled. |
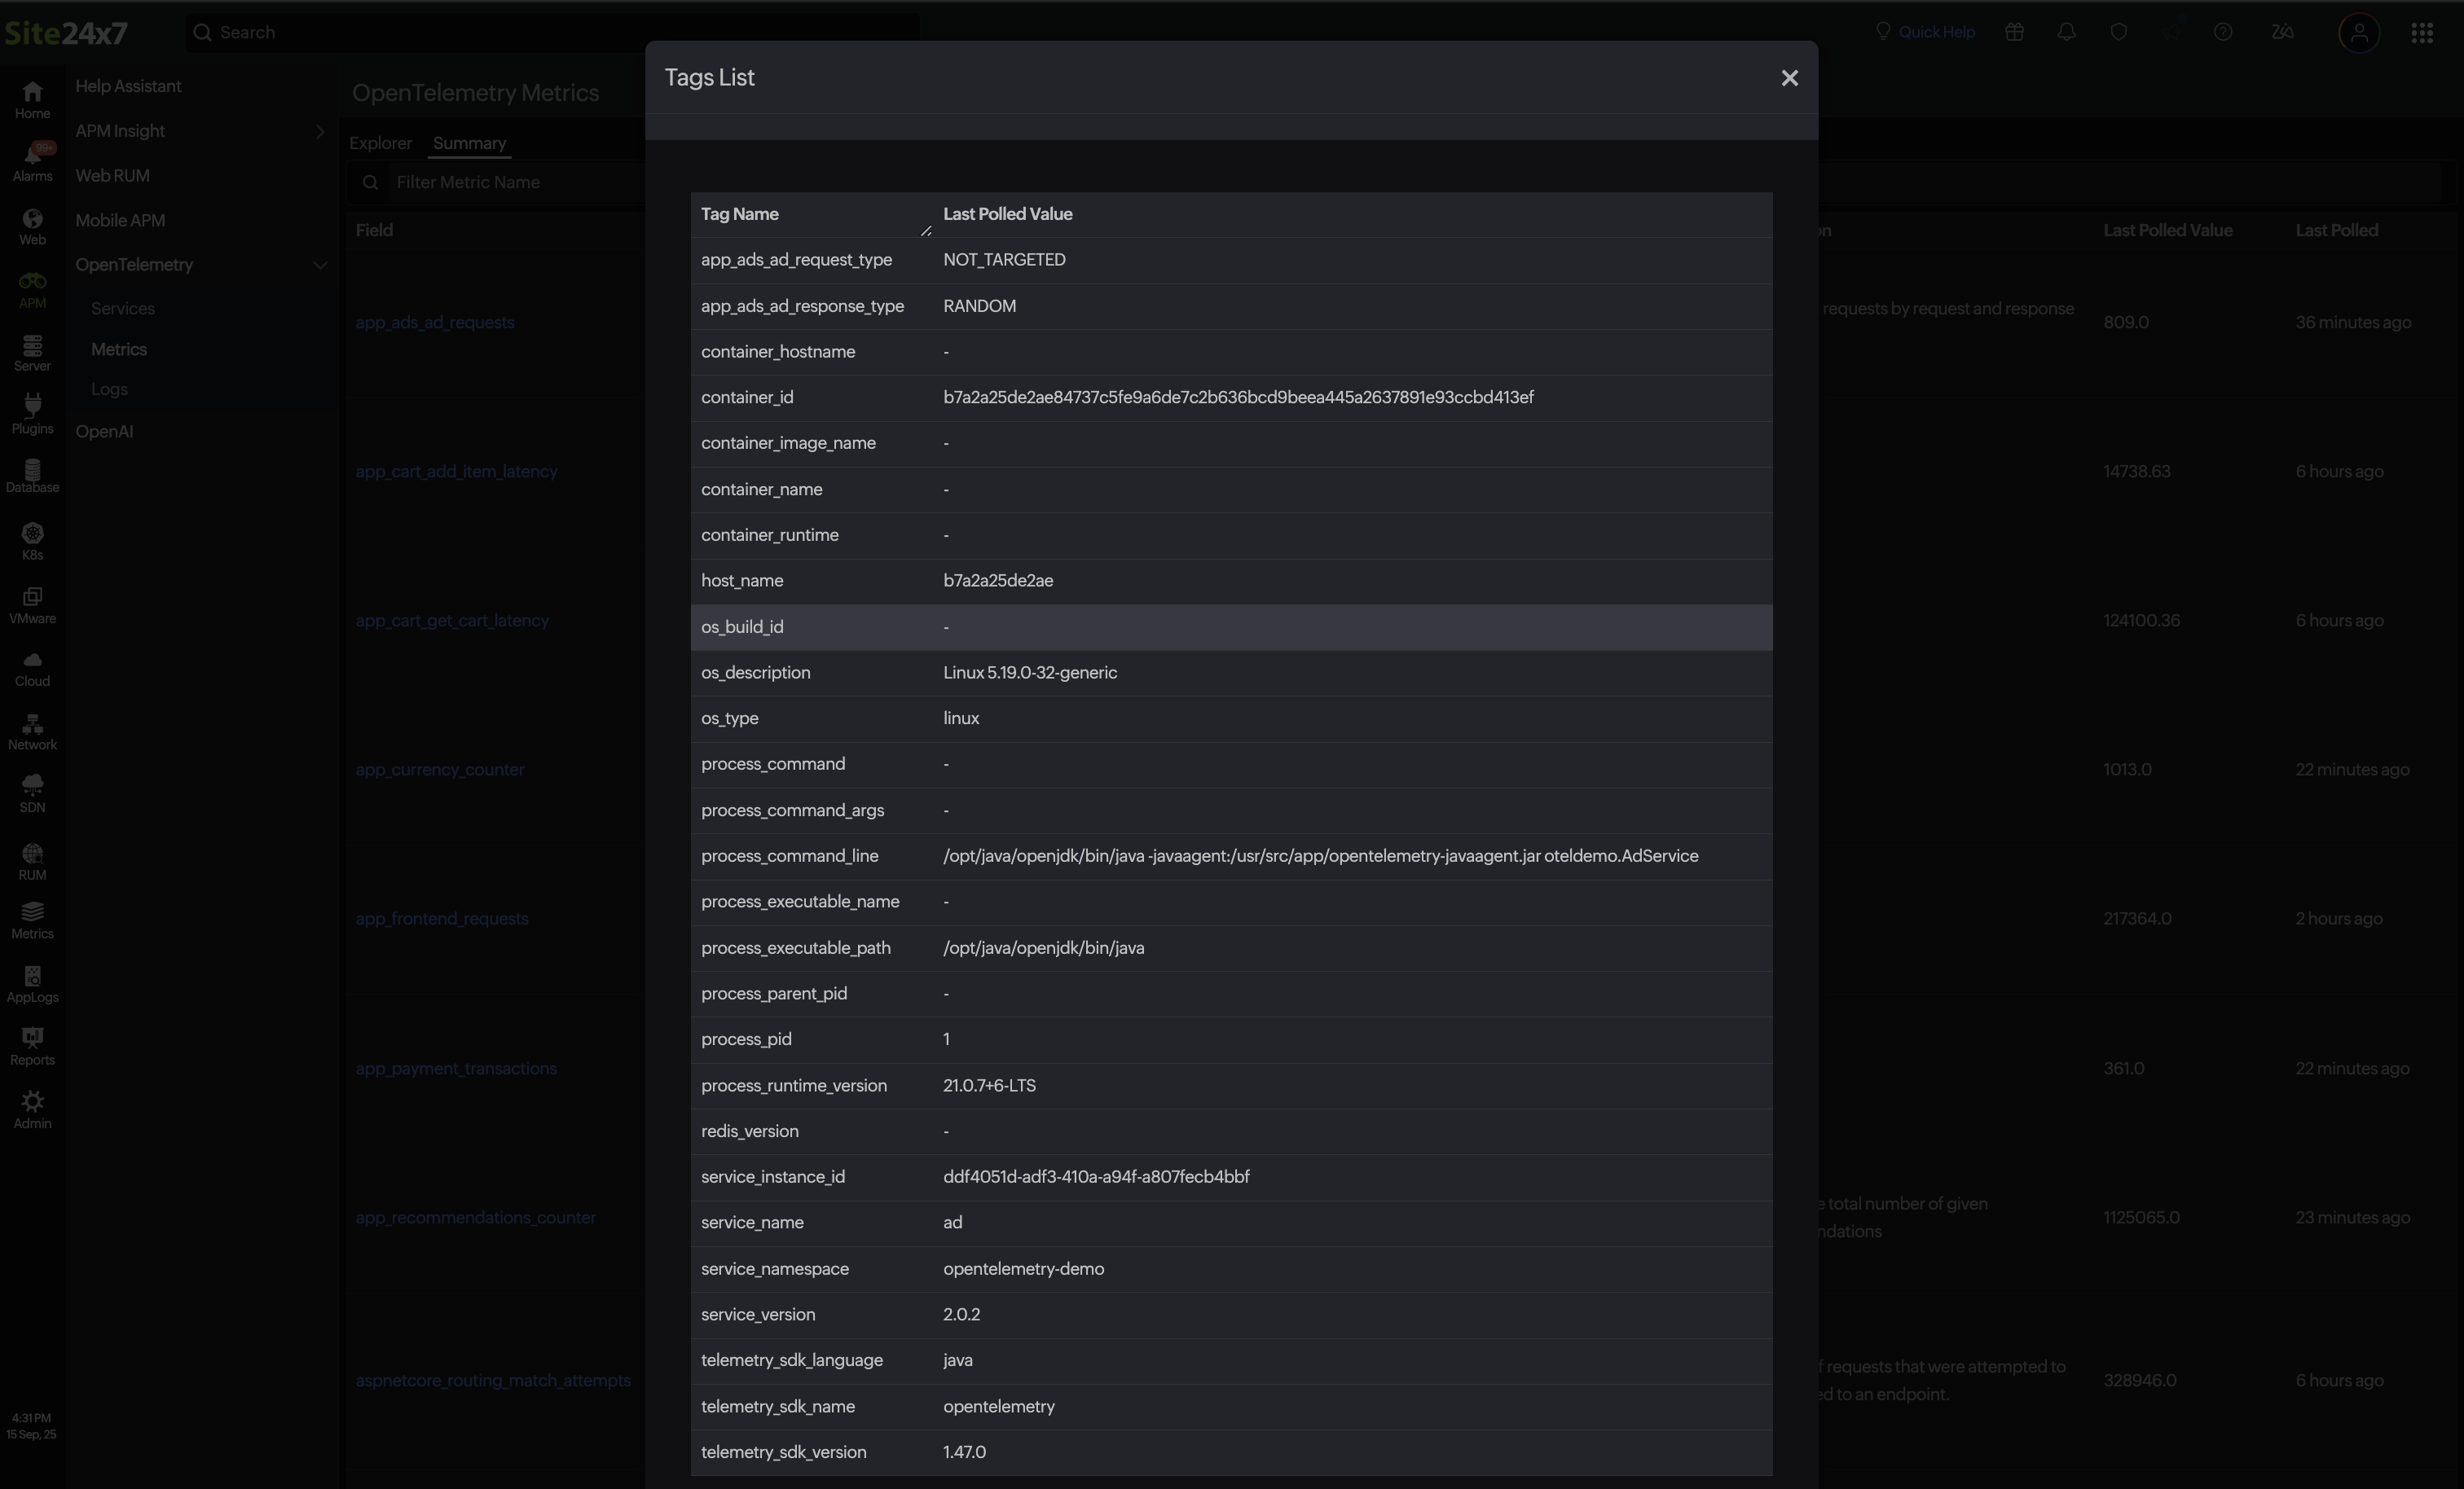
By clicking on the Tags parameter, you can access a detailed Tags List of the metrics, showing the real-time operational status from the last telemetry poll. These tags are the combination of resource and metrics tags
- Tag Name: Displays each specific attribute of the monitored entity.
- Last Polled Value: Displays the most recent data collected for that attribute.
Related articles
-
On this page
- Explorer tab
- Summary
- Related articles
