Tell us what you need in our Firewall Analyzer
Take the survey
Network monitoring is continuously observing, managing, and optimizing a network to maintain maximum performance, reliability, and security. It provides real-time visibility into devices, traffic patterns, and potential threats so IT teams can detect, diagnose, and resolve issues proactively before they disrupt operations.
Additionally, it delivers strategic insights by analyzing historical performance data, traffic trends, and device utilization. This analysis enables teams to forecast capacity needs, optimize resource allocation, and make informed decisions regarding network upgrades or expansions. Ultimately, effective monitoring helps reduce downtime, enhance user experience, and support long-term business growth.
Why is network monitoring important?
Network monitoring is essential for maintaining the smooth operation of a network. It helps you optimize the overall performance and identify potential issues before they escalate.
What happens if you do not monitor your network?
Unexpected network downtime
Unforeseen security breaches
Random performance bottlenecks
Results
A loss of productivity
Financial losses
Damage to your organization's reputation
Compromised data integrity
What happens if you monitor your network?
Bandwidth congestion identification
Suspicious activity tracking
Performance bottleneck troubleshooting
Results
A reduction in downtime, which leads to increased productivity
Improved network efficiency, which translates to financial gains
An enhanced overall user experience, which leads to improved trust
Easy compliance with policies, which improves your security posture
How can you implement full-fledged network monitoring?
Implementing monitoring effectively is best approached in structured phases to ensure scalability and long-term value:
Phase 1: Assessment
- Define clear objectives and performance requirements aligned with your business SLAs.
- Inventory your current network devices, traffic patterns, and compliance needs.
- Evaluate your organization's size and complexity to determine suitable monitoring strategies.
Phase 2: Pilot
- Select the right tool and deploy it in a controlled environment.
- Test key metrics, alerting thresholds, and visualization options on a small set of devices.
- Validate integration with existing ITSM or security tools.
Phase 3: Rollout
- Add all network devices and endpoints.
- Configure thresholds and alert requirements.
- Decide between agent-based and agentless monitoring depending on device type, security policies, and performance needs.
- Choose on-premises deployment for strict data control, or SaaS for scalability and to reduce maintenance.
Phase 4: Optimization
- Create dashboards and generate reports as needed.
- Continuously refine thresholds, alert routing, and escalation policies based on real incidents.
- Use analytics to identify performance bottlenecks and forecast capacity.
- Review tool performance periodically and reassess it for network growth or technology changes.
Decision frameworks
- Small vs. large networks: Smaller networks may prioritize ease of use and cost efficiency, while large enterprises need advanced automation, multi-site visibility, and compliance reporting.
- Agent vs. agentless: Agent-based offers deeper device insights but requires more management; agentless is faster to deploy and reduces overhead.
- On-premises vs. SaaS: On-prem provides greater control and data residency compliance; SaaS offers quick scaling, lower maintenance, and global accessibility.
Types of network monitoring tools
A single tool can combine multiple types of network monitoring to leverage the advantages of each.
| Tool type | Pros | Cons | Use case |
|---|---|---|---|
| SaaS (Cloud) | Fast deployment, automatic updates, global access, minimal IT overhead | Dependent on internet connectivity, data residency concerns | Distributed or rapidly growing networks |
| Full data control, custom security policies, integration with legacy systems | Full data control, custom security policies, integration with legacy systems | Higher upfront costs, ongoing maintenance | Enterprises with strict compliance needs |
| Open-source | Low cost, high customization, strong community support | Steeper learning curve, limited vendor support | Skilled IT teams with budget constraints |
| AI-driven | Predictive analytics, automated root-cause detection, reduced mean time to repair | Typically higher cost, requires trust in algorithms | Large, complex, or hybrid environments |
What are network monitoring tools?
Network monitoring tools are applications that help network administrators monitor and manage the performance of their network. These tools provide real-time insights into network traffic, bandwidth usage, device health, and security threats. By using network monitoring tools, administrators can quickly identify and resolve issues, optimize network performance, and ensure high overall network reliability and security.
Types of network monitoring protocols
- Simple Network Management Protocol (SNMP)
- Windows Management Instrumentation (WMI)
- Internet Control Message Protocol
- Cisco Discovery Protocol
- Traffic monitoring protocols like NetFlow, sFlow, J-Flow, Cflow, IPFIX, NetStream, and AppFlow
- Syslog
How does network monitoring work
- Data collection
For optimal performance and security, it is important to track metrics consistently from different network devices, such as switches, routers, and firewalls. These vital metrics can be effectively transmitted to a network monitoring tool using protocols like SNMP or WMI.- SNMP data collection methods include polling, traps, or SNMP commands.
- WMI data is collected either through queries or events.
- Analysis and alerts
- Data analysis
- Data aggregation: Collected data from various sources (SNMP traps, WMI queries, logs, etc.) is aggregated and displayed consistently in the UI.
- Trend analysis: Historical data is analyzed to identify trends over time. This includes looking at usage patterns, performance metrics, and resource utilization to predict potential issues.
- Threshold settings: Define thresholds for required KPIs to receive alerts on breaches.
- Anomaly detection: Advanced monitoring tools use machine learning and statistical methods to detect anomalies.
- Correlation: Analyze data to pinpoint potential causes of issues. For example, high network latency may be linked to spikes in a specific device's CPU usage.
- Alert generation
- Triggering events: These include thresholds, anomalies, or significant events. For instance, a network device going offline might trigger an alert.
- Severity levels: There include trouble, warning, and critical. Critical alerts might require immediate attention, while trouble alerts may just require acknowledgment.
- Customizable alerts: Specify which events should trigger notifications based on your operational needs.
- Alert delivery
- Notification methods
- SMS
- Integrations with third-party systems
- Notification methods
- Logging and history
All alerts are typically logged for historical analysis, helping teams track issues over time and refine their monitoring strategies.
- Data analysis
- Reporting
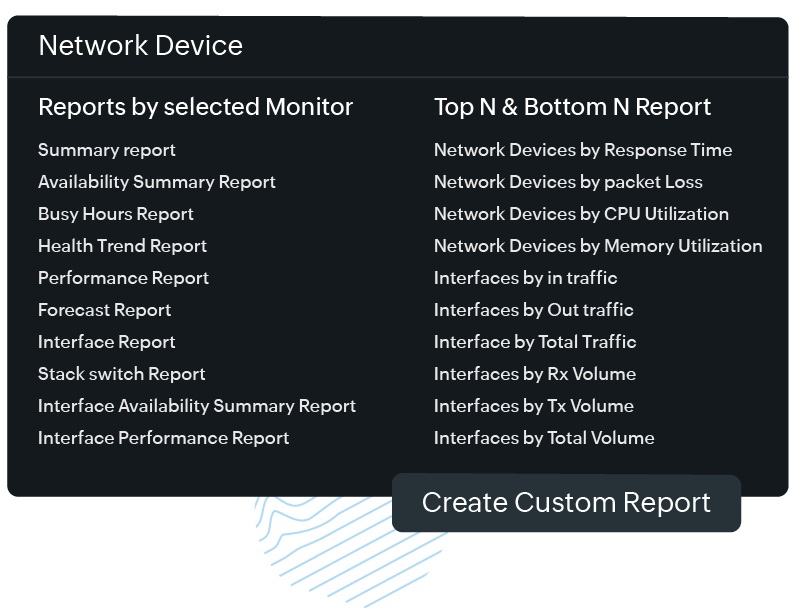
- Built-in reports: Get detailed reports on monitors, monitor groups, SLAs, outages, and more to track trends over a specific period. Export these reports in CSV, PDF, and email formats for internal use.
- Top N reports: View the top and bottom values of a specified performance attribute by utilizing top N and bottom N reports. The data will be presented in a table format and sorted based on the monitored parameter.
- Automated reports: Schedule regular reports (daily, weekly, and monthly) to make certain that any report can automatically be generated and sent to stakeholders, ensuring they stay informed about network performance without manual intervention.
- Customizable reports: Users can customize reports to focus on specific metrics or devices, allowing them to tailor the information to their needs. For instance, a report could be created to focus solely on critical network devices or specific geographic regions.
- Visualization
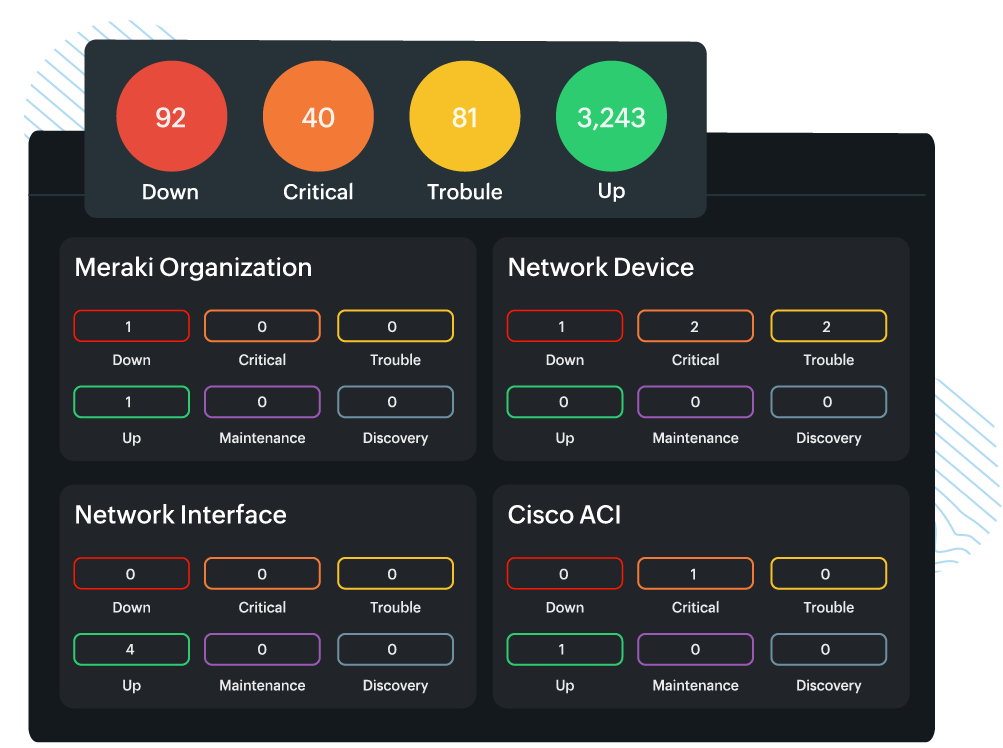
- Dashboards: Visualization starts with dashboards that provide real-time overviews of network health. Dashboards can include widgets for key metrics, status indicators, and charts.
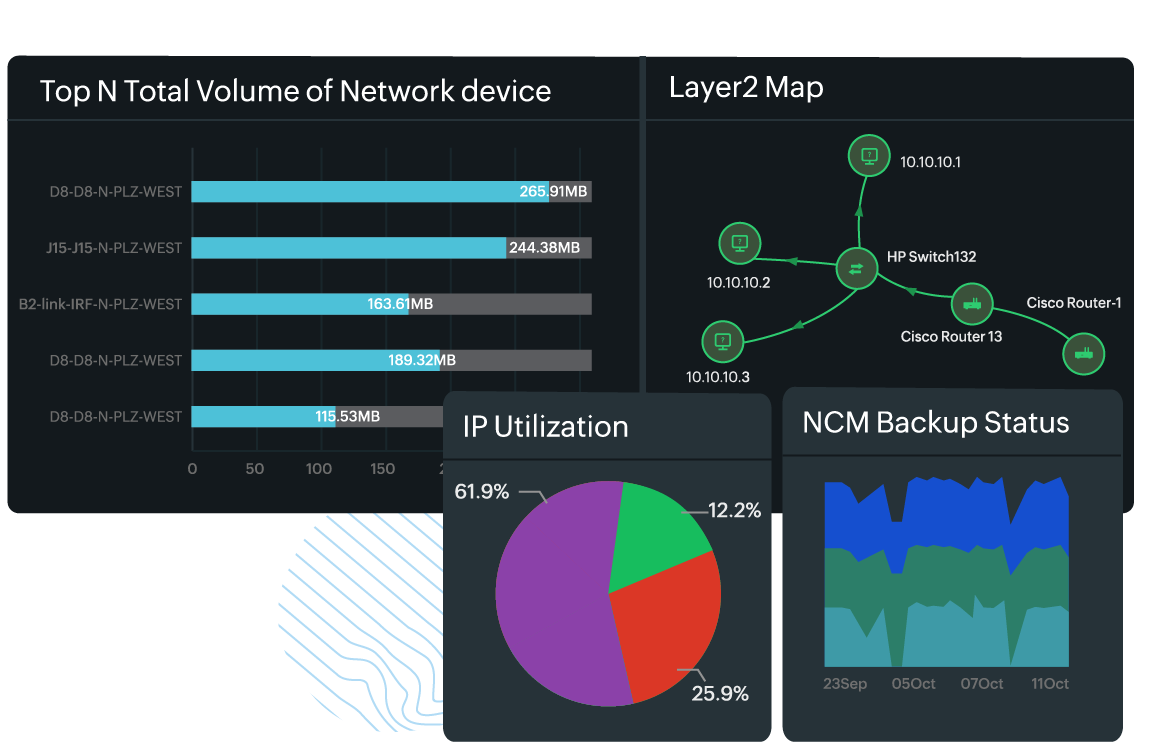
- Graphs and charts: Common visualizations include line graphs, bar charts, pie charts, and heat maps. These help convey information clearly and quickly, making it easier to spot trends, spikes, or anomalies.
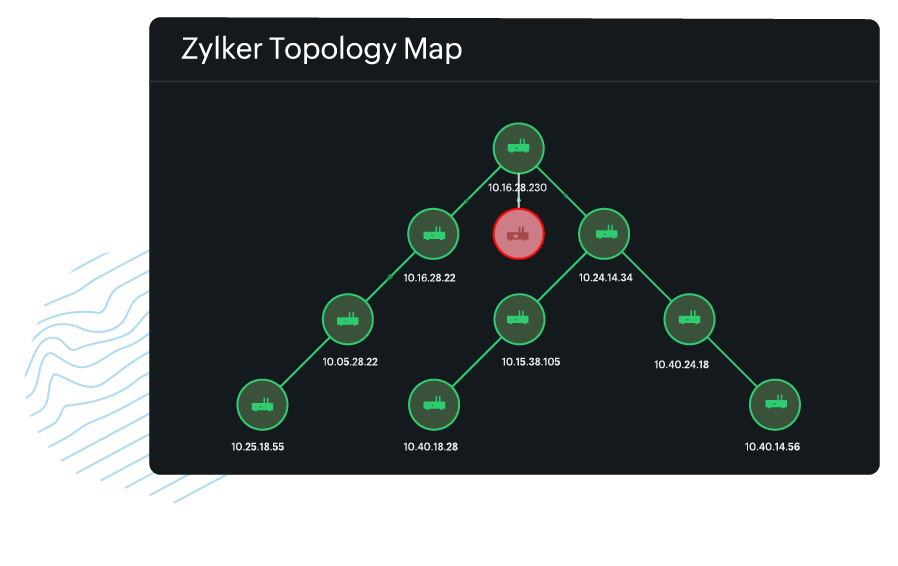
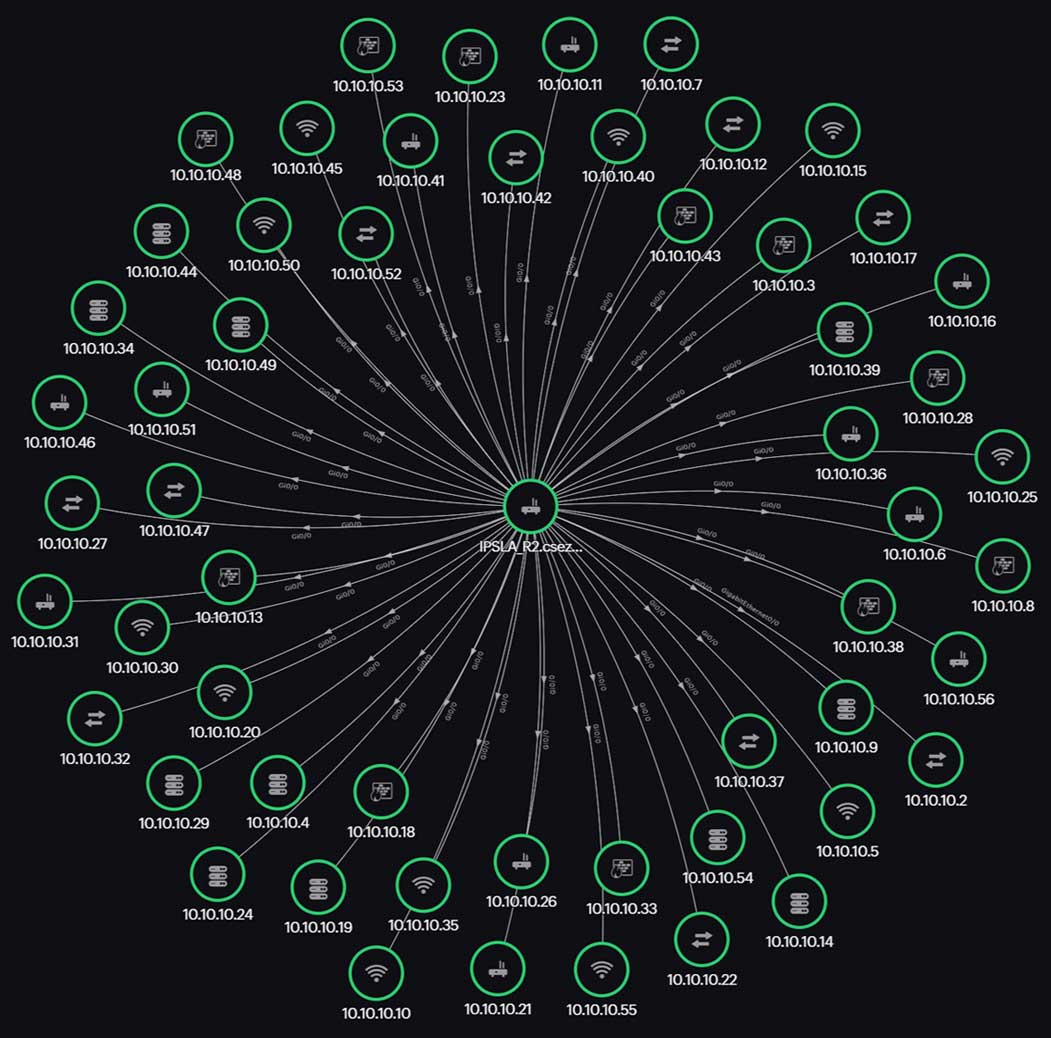
- Maps: Visual representations of networks, like topology and Layer 2 maps, illustrate device connections and relationships. They help you understand the layout and identify potential points of failure.
- Drill-down features: Users can often click visual elements to drill down to more detailed data, such as specific device metrics or historical performance for a particular service.
- Alert visualizations: Alerts are visually highlighted on dashboards, often with color coding (e.g., red for critical alerts and yellow for warnings), to help administrators prioritize their responses.
- Dashboards: Visualization starts with dashboards that provide real-time overviews of network health. Dashboards can include widgets for key metrics, status indicators, and charts.
- API-based monitoring
- REST APIs and vendor-specific APIs are increasingly used to gather metrics directly from cloud platforms, SD-WAN controllers, and SDN fabrics.
- APIs provide granular, real-time telemetry and configuration data that SNMP might not expose.
- API-baesd monitoring is ideal for hybrid, multi-cloud, and software-defined architectures where programmability and automation are key.


What are the key network devices that need to be monitored?
Monitoring should cover a wide range of hardware and services to maintain performance and security:
- Routers and switches
- Firewalls and VPN gateways
- Wireless access points and LAN controllers
- Load balancers and VPNs
- SANs
- SDN controllers and programmable switches (for software-defined networking visibility)
- SD-WAN edge devices, hubs, and controllers (for application-aware routing and path performance)
Key metrics to track
- CPU and memory utilization
- Bandwidth usage and interface errors
- Packet loss, jitter, and latency
- Device configuration changes and firmware vulnerabilities
- Policy compliance for SDN flows and SD-WAN routing paths
- Link health and failover performance for SD-WAN connections
Common challenges in network monitoring
- Increasing costs and complexity: Modern organizations rely on a combination of on-premises, cloud, and software-defined components to operate efficiently. But how do you ensure seamless visibility across these varied environments without using multiple, often costly, monitoring tools?
- Networks that handle workforce fluidity: With remote and hybrid work environments common today, network traffic patterns are constantly shifting. Is your current monitoring solution equipped to scale dynamically and handle the ever-changing device and traffic landscape without compromising performance?
- Information overload: Network devices generate an overwhelming amount of data every second. How do you filter this noise to quickly identify and address critical issues that could disrupt your operations?
- Security threats: The threat landscape evolves constantly, making real-time threat detection and response essential. Can your monitoring tools help you differentiate between legitimate network traffic and potential threats before damage is done?
- System integration: Introducing new tools into an already complex IT environment is challenging. How can you ensure that your monitoring solutions integrate seamlessly with existing systems without causing disruption?
- Encrypted traffic visibility: The growing use of TLS 1.3 and encrypted east–west traffic can obscure malicious activities. Monitoring tools should adapt with techniques like decryption proxies or metadata-based analysis to maintain security insights without violating privacy.
- Hybrid and multi-cloud complexity: Enterprises increasingly deploy workloads across AWS, Azure, Google Cloud, and on-premises data centers. Monitoring should unify metrics and logs from disparate environments without creating blind spots.
- Edge computing challenges: With IoT devices and edge data centers proliferating, monitoring solutions should extend beyond traditional core networks to endpoints at the edge, where connectivity and processing constraints can complicate visibility.
- Alert fatigue: High-volume, low-priority alerts can overwhelm IT staff, leading to critical warnings being overlooked. Modern solutions should use correlation, AI-based prioritization, and suppression rules to surface only actionable insights.
Case study
Retail chain tackling hybrid complexity
A global retail chain expanded to SDNs and SD-WANs while maintaining on-premises ERP servers. Initially, their NOC faced hundreds of redundant alerts daily due to hybrid blind spots. By adopting a monitoring platform that monitors both API feeds from SDNs and SD-WANs with SNMP polling of on-premises devices, they reduced noise by 45% and pinpointed a misconfigured SD-WAN policy causing intermittent outages at multiple branches.
Financial firm and encrypted traffic
A financial services firm struggled to detect insider threats after adopting TLS 1.3 across internal applications. By implementing metadata analysis and selective decryption with compliance safeguards, they restored visibility without breaching privacy requirements and prevented a potential data exfiltration incident.
Best practices in network monitoring
- Set clear goals: What do you wish to achieve? Define your objectives to help you focus your efforts. Your goals could include minimizing downtime, optimizing performance, and strengthening security, as well as specific objectives unique to your organization. Include governance and compliance considerations early—define which regulations (for example, HIPAA, the PCI DSS, and the GDPR) apply, and ensure your monitoring strategy aligns with audit and reporting requirements.
- Choose the right tools: Does your current tool align with your organization's specific needs? Look for solutions like Site24x7's network monitoring that are scalable, cost-effective, and capable of integrating smoothly with your existing infrastructure. Prioritize tools that support anomaly detection, continuous baseline learning, and deep observability integration (metrics, logs, and traces) for comprehensive visibility across hybrid environments.
- Adopt continuous monitoring: Why wait for issues to arise? By monitoring network performance and configurations regularly, you can detect and resolve problems before they affect your business. Baseline learning allows your monitoring platform to understand normal behavior patterns over time, making anomaly detection more accurate and reducing false positives.
- Establish thresholds and alerts: How can you stay ahead of potential issues? Using Site24x7, you can display key metrics in a customized dashboard and create alert systems to receive notifications via your preferred channels, such as email, SMS, voice call, or mobile apps. Leverage AI-based anomaly detection to supplement static thresholds, and ensure emerging problems are caught even when traffic patterns shift.
- Review and optimize performance: When was the last time you analyzed your network's performance? Regularly review your data to uncover bottlenecks or inefficiencies that might be slowing you down. Integrate observability practices—correlating network data with application and infrastructure metrics—to pinpoint root causes quickly.
- Prioritize security monitoring: How well is your network prepared to address the increasing number and complexity of cyberattacks? Incorporating robust security monitoring helps you safeguard your networks against unauthorized access, firmware vulnerabilities, and compliance violations that could cause your organization to lose revenue and reputation. Ensure compliance monitoring is built in, generating audit-ready reports for governance teams.
By asking the right questions and following these updated best practices, including anomaly detection, observability, and compliance governance, you can transform your approach into a proactive, resilient system that strengthens performance, security, and trust.
Key benefits of network monitoring
Improved network performance
- Identify and troubleshoot bottlenecks.
- Optimize bandwidth usage.
An enhanced security posture
- Detect and respond to suspicious activity.
- Prevent data breaches and cyberattacks.
Reduced downtime and outages
- Proactively identify and resolve issues.
- Minimize disruptions to business operations.
Cost savings
- Prevent expensive downtime and data loss.
- Optimize resource allocation and cut down on hardware expenditures.
Improved IT efficiency
- Streamline network management.
- Automate alerts and reporting.
What are the key factors to consider when choosing a network monitoring solution?
1. Core capabilities
- Network discovery: Automatic identification of network devices and their configurations
- Performance analysis: In-depth analysis of network performance trends to identify bottlenecks and optimize resource utilization
- Real-time monitoring: Continuous tracking of network performance metrics, including bandwidth utilization, latency, and packet loss
- Network configuration management (NCM): Network configuration and change management capabilities for comprehensive monitoring
- Network automation: Ability to execute scripts to apply configuration changes across network devices
- Alerting and notifications: Timely alerts for critical issues, such as device failures or security breaches
- Security monitoring: Detection of security threats, including unauthorized access attempts and malicious activity
- Reporting: Customizable reports for detailed insights into network health and performance
- Observability integration: Support for logs, metrics, and traces to correlate network performance with application and infrastructure health
2. Scalability
- The ability to grow: Scale with your network's expansion, handling increasing numbers of devices and traffic—preferably with SaaS elasticity
- Support for any network: Support for various deployment models, including on-premises, cloud-based, or hybrid
3. Ease of use
- An intuitive interface: Easy navigation and configuration
- A shorter learning curve: Minimal training for users with varied levels of technical expertise
4. Integration capabilities
- Third-party integrations: Compatibility with ITSM, SIEM, and collaboration platforms
- API support: Integrations with automation tools for streamlined workflows
5. Support and reliability
- Responsive support: Reliable, timely technical support from the vendor
- Enhancements: Frequent updates to address vulnerabilities and add new features
- Vendor reliability: Evaluate vendor history, uptime guarantees, and community reputation
- Product roadmap: Assess the vendor's commitment to innovation and alignment with emerging network technologies
6. Costs
- The licensing model: Evaluate costs based on devices, users, or bandwidth usage
- TCO: Consider initial purchase costs, maintenance fees, training expenses, and long-term operational efficiency
7. Security
- Data encryption: Strong encryption for sensitive data like credentials
- Access controls: Robust access controls to protect against unauthorized access
- Privacy practices: Understand how vendors handle telemetry data, logs, and customer information
- Compliance: Ensure alignment with standards like SOC 2, HIPAA, or the GDPR
8. Deployment model and future-proofing
- Cloud vs. on-premises: Evaluate based on latency, compliance, and security needs
- Future-proofing: Check if the solution supports SD-WAN, SDN, edge, and multi-cloud environments
| Criteria | SaaS solution | On-premises solution | Open-source tool | AI-driven solution |
|---|---|---|---|---|
| Scalability | Excellent elasticity | Limited by hardware | Moderate | Excellent |
| Ease of use | High (vendor-managed) | Medium (requires internal expertise) | Low–Medium | High |
| Integration | Strong API and marketplace options | Custom integrations needed | Varies by project | Strong automation and ML features |
| Security and privacy | Vendor-managed encryption and access | Full local control | Varies, might lack enterprise features | Strong encryption and anomaly detection |
| Cost and TCO | Subscription-based, predictable | High upfront and maintenance | Low upfront, high expertise cost | Higher subscription, ROI from insights |
| Vendor reliability | Backed by SLAs and 24/7 support | Depends on in-house IT | Community support | Vendor-backed, often cutting-edge |
| Future-proofing | Frequent updates, AI features | Hardware upgrades needed | Slower community-driven updates | Excellent roadmap alignment |
Site24x7: A 1-stop solution for complete network monitoring
Easy deployment, easier maintenance, and a peerless scope of coverage based on continuous research that has fostered over 15 years of invaluable customer trust
- Multi-location monitoring
Allows monitoring from multiple geographic locations, helping you assess performance from different user perspectives - SNMP and WMI support
Supports standard protocols like SNMP for monitoring network devices and WMI for Windows servers, making it versatile across different environments - Multiple visualization options
Offers customizable dashboards that can display key metrics and visualization options like topology and Layer 2 maps, which provide a consolidated view of network health - Monitoring for any device
Allows you to choose a device template to match your device type from over 11,000 options or to create a custom one - Comprehensive monitoring
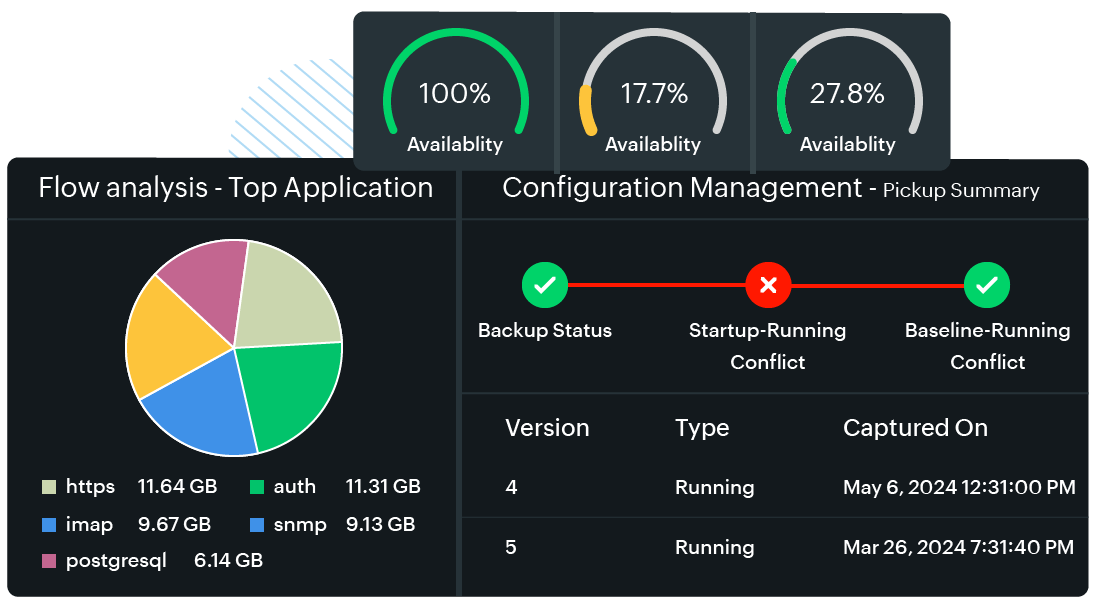
Provides NCM that also includes firmware vulnerability management and network configuration compliance - Network automation
Lets you easily create scripts that can be executed automatically based on compliance rules - Support for software-defined networks and SD-WANs
Monitors software-defined networks and SD-WANs, like Cisco Meraki, Cisco Application Centric Infrastructure, and VMware VeloCloud, apart from supporting on-premises networks - Alerting and notifications
Offers configurable alerts based on thresholds for various metrics, with notifications delivered via email, SMS, or integrations with other tools (e.g., Slack and PagerDuty) - Reporting and analytics
Generates detailed reports on performance trends, availability, and compliance, and these reports can be scheduled and customized
How does the Site24x7 network monitoring tool work?
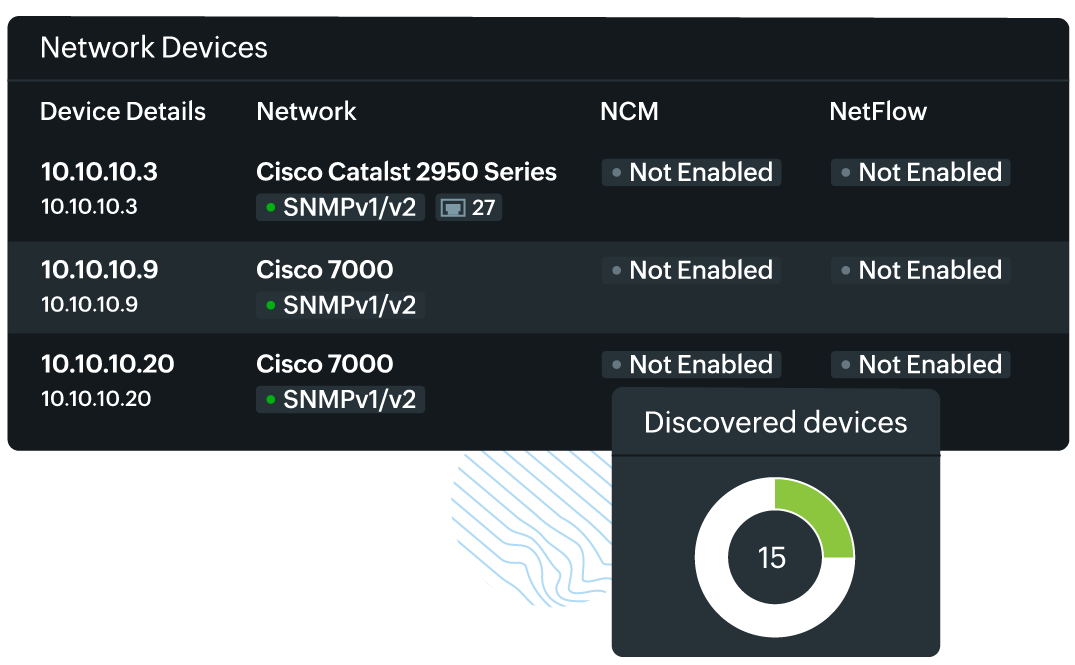
Site24x7 Network Monitoring is an SNMP-based, agentless, SaaS tool that collects data from your network using an On-Premise Poller. This helps monitor your internal and external networks. You can either specify an IP range or use classless inter-domain routing (CIDR) to discover the devices in your network. You can mention discovery rules and device and interface filters, which help to fine-tune the discovery. Once added, the On-Premise Poller starts to fetch data like traffic, bandwidth, packets, error, discards, and other performance data from your devices.
You can configure threshold limits for all the key performance metrics at the device and interface level so that you can take corrective measures on any breach and keep the network performance under control using our cloud network monitoring tool.

Ready to see network monitoring in action?
Start your 30-day free trial now and see exactly how network monitoring transforms uptime, performance, and security.