Customers
Access customers from home to get a high-level view of your customer accounts.
Customer Health View
The Customer Health View provides a comprehensive summary of all customer accounts and their associated monitor statuses at a glance. This view helps you quickly assess the health of each customer and prioritize actions based on active alarms.
You can refresh your Site24x7 Customer Health View by clicking the refresh  icon to get the updated data. By default, this view is refreshed every five minutes. Site24x7's Status API fetches the data and caches it for five minutes. The cached data is automatically cleared at the end of this interval. Caching is applied exclusively to the Customer Health View.
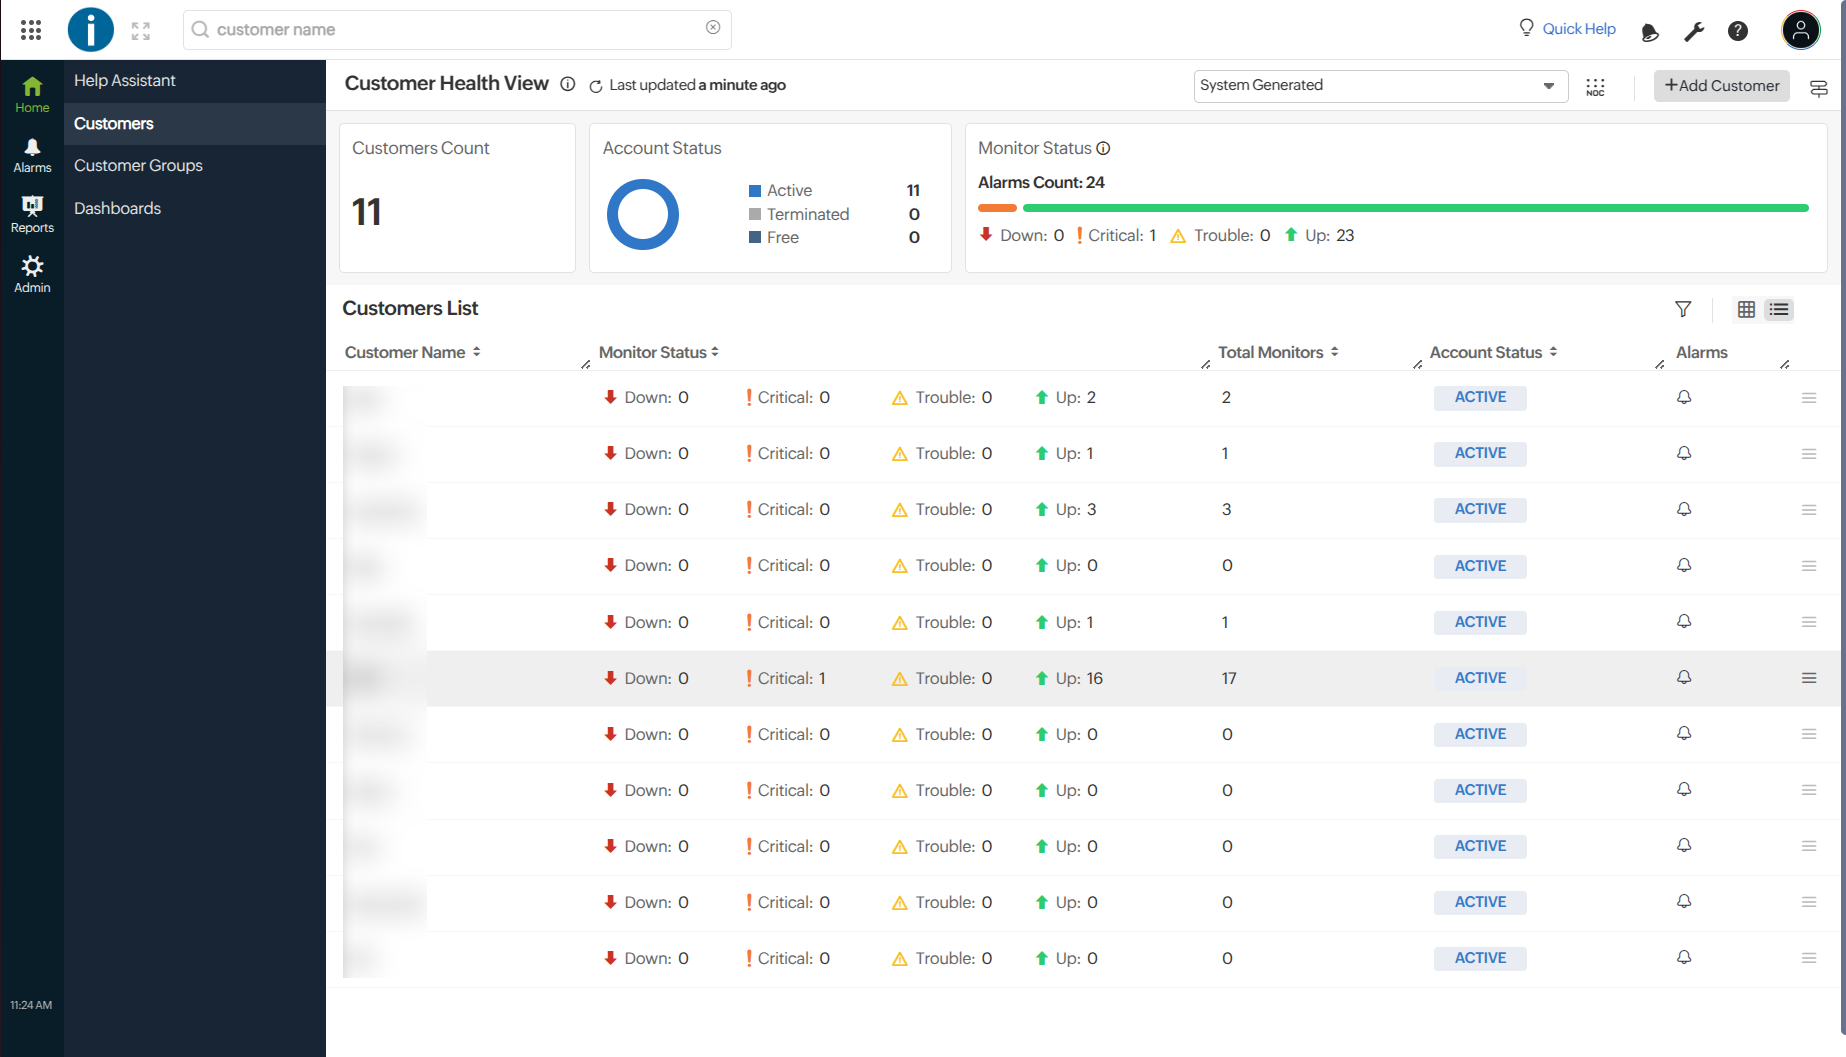
You can view the list of customer groups and filter them using the drop-down menu. With group-based views, you can easily find the customers associated with each group. This feature enhances performance and helps streamline your workflow by organizing it around customer groups.
- Login to MSP Account.
- Click Home > Dashboards listed on the MSP dock.
- You can view all customer accounts configured under your Site24x7 MSP account.
This view displays the Customers' information based on the Customer Group:
- Customer Count: Shows the total number of customer accounts being monitored.
- Account Status: A visual breakdown of customer accounts based on their current state:
- Active: Accounts that are actively monitored.
- Terminated: Accounts that are no longer monitored.
- Free: Accounts that are currently unassigned or inactive.
- Monitor Status: A visual representation of the total alarm count, categorized as Down, Critical, Up, and Trouble, along with their respective counts.
View types
The Customer Health View is categorized into two views:
- List view
- Grid view
List view
In this view, customer accounts are displayed in a tabular format. You can filter customer groups using the drop-down menu, which helps improve performance and streamline your workflow.
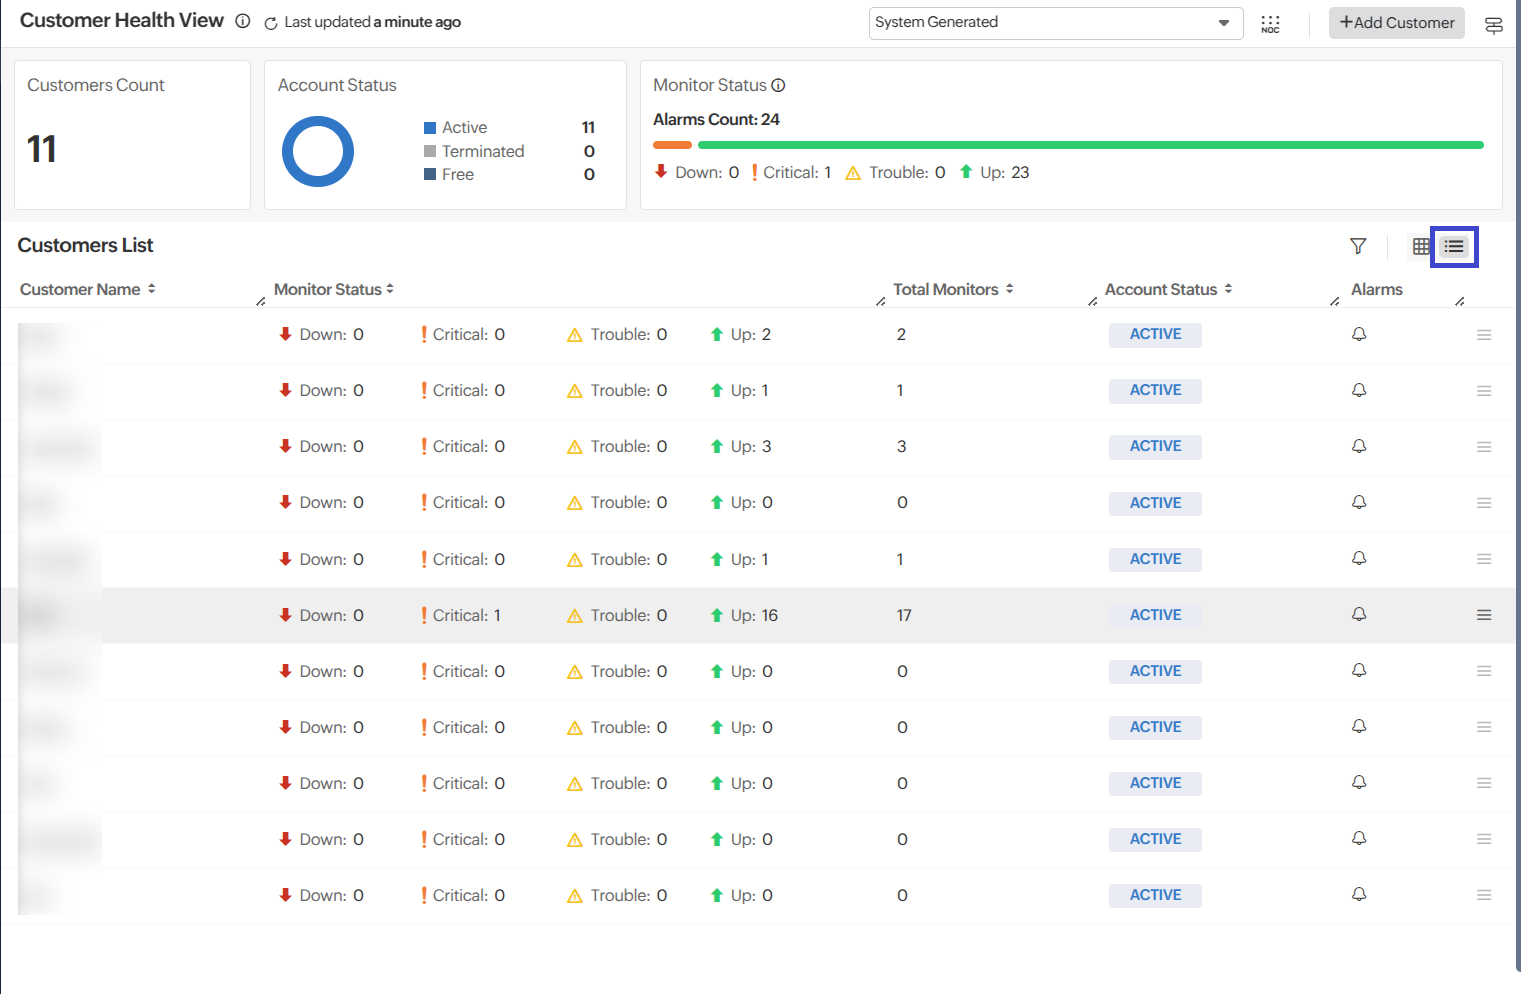
The following metrics are displayed:
| Metrics | Description |
| Customer Name | Identifies each customer account. |
| Monitor Status | Displays the alert status of monitors for individual customers. Refer to the table below for the status icons and their meanings. |
| Total Monitors | Indicates the total number of monitors associated with the customer. |
| Account Status | Shows the status of the customer account (Active, Terminated, and, Free). |
| Alarms | Clicking the alarm |
| Icon | Description |
| Down | |
| Critical | |
| Trouble | |
| Up |
Grid view
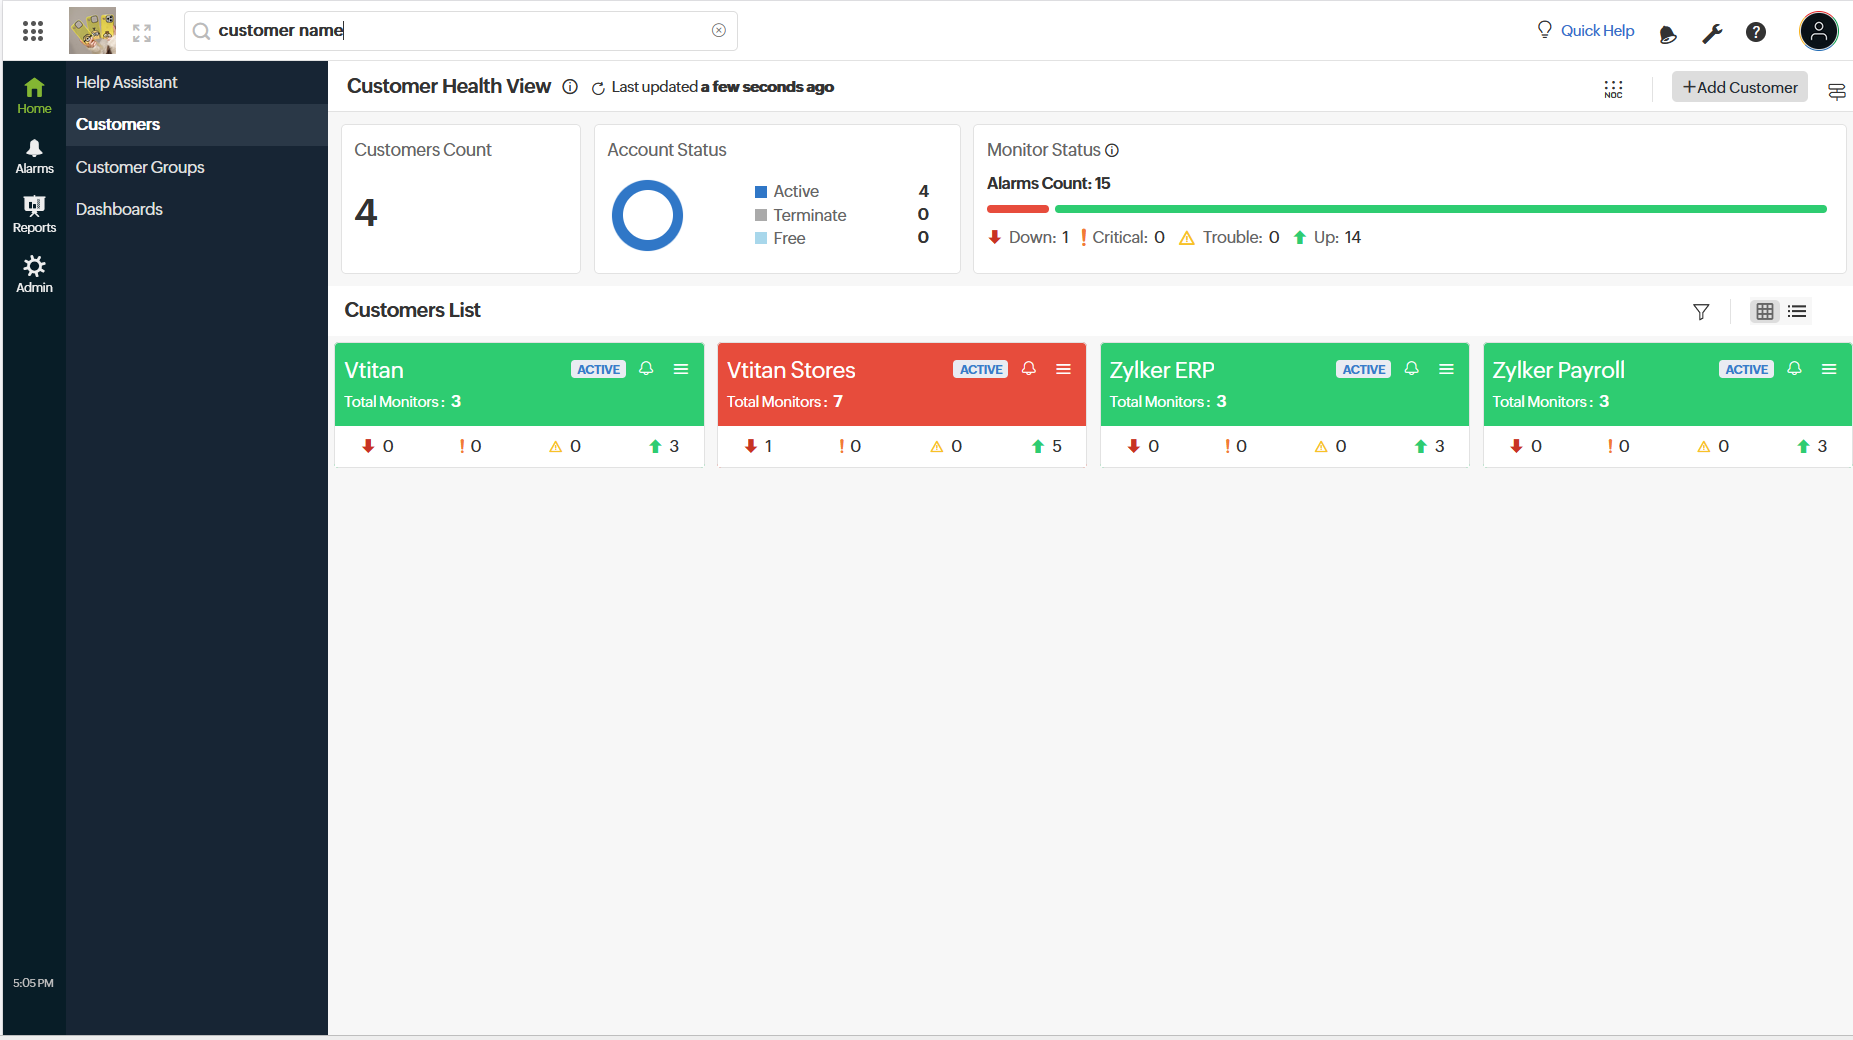
Click the grid ![]() icon to switch to the Grid View. This view displays the customers' details as status cards.
icon to switch to the Grid View. This view displays the customers' details as status cards.
Each status card displays the following details:
- Monitor Name
- Account Status
- Total Monitors
- Monitor Status
You can access any customer account under your MSP group by clicking the respective status card.
To access a customer account, you must have either created the account or be explicitly associated with it.
Each status card also includes an alarm ![]() icon — clicking on it will navigate you to the Alarms page.
icon — clicking on it will navigate you to the Alarms page.
- The default view is the List view.
- Clicking the hamburger
 icon next to a customer will navigate you to the respective Monitors page.
Learn more about the MSP Roles and privileges.
Filter by monitor status
You can filter customers based on their monitor status. Click the filter ![]() icon to apply filters by monitor status.
icon to apply filters by monitor status.
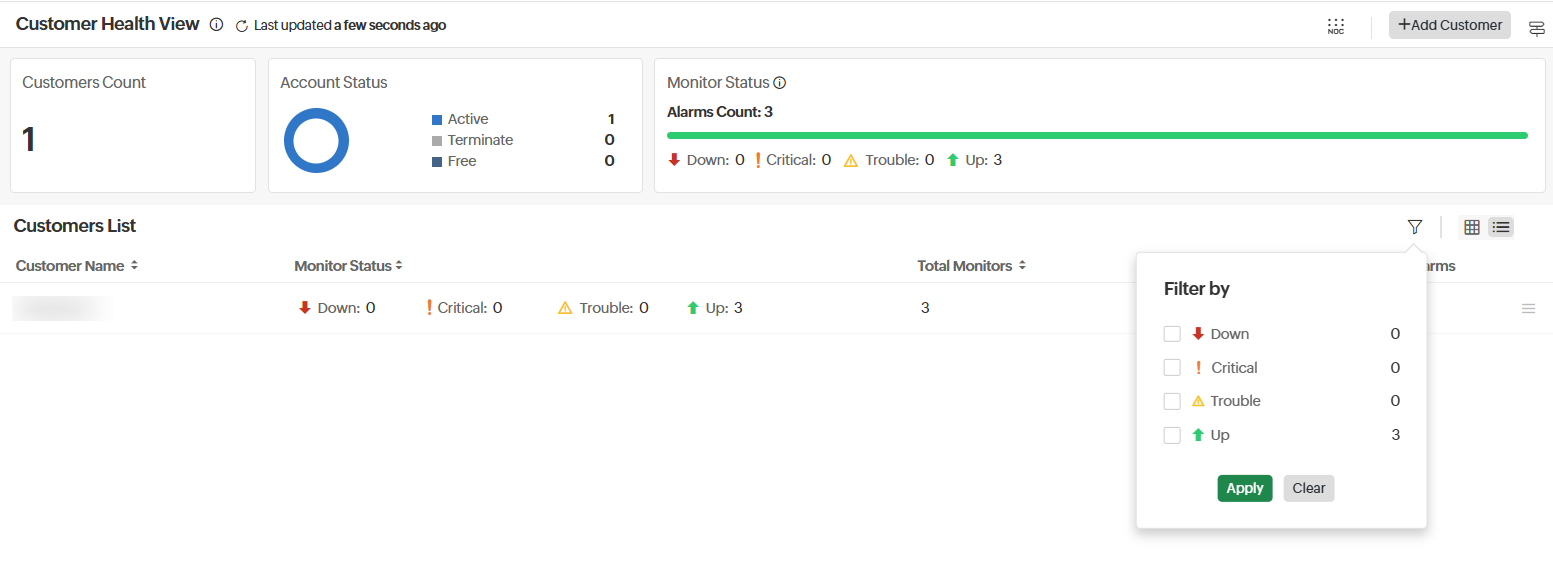
You can also add new customers by clicking the + Add Customer button.
Network Operations Control (NOC) view
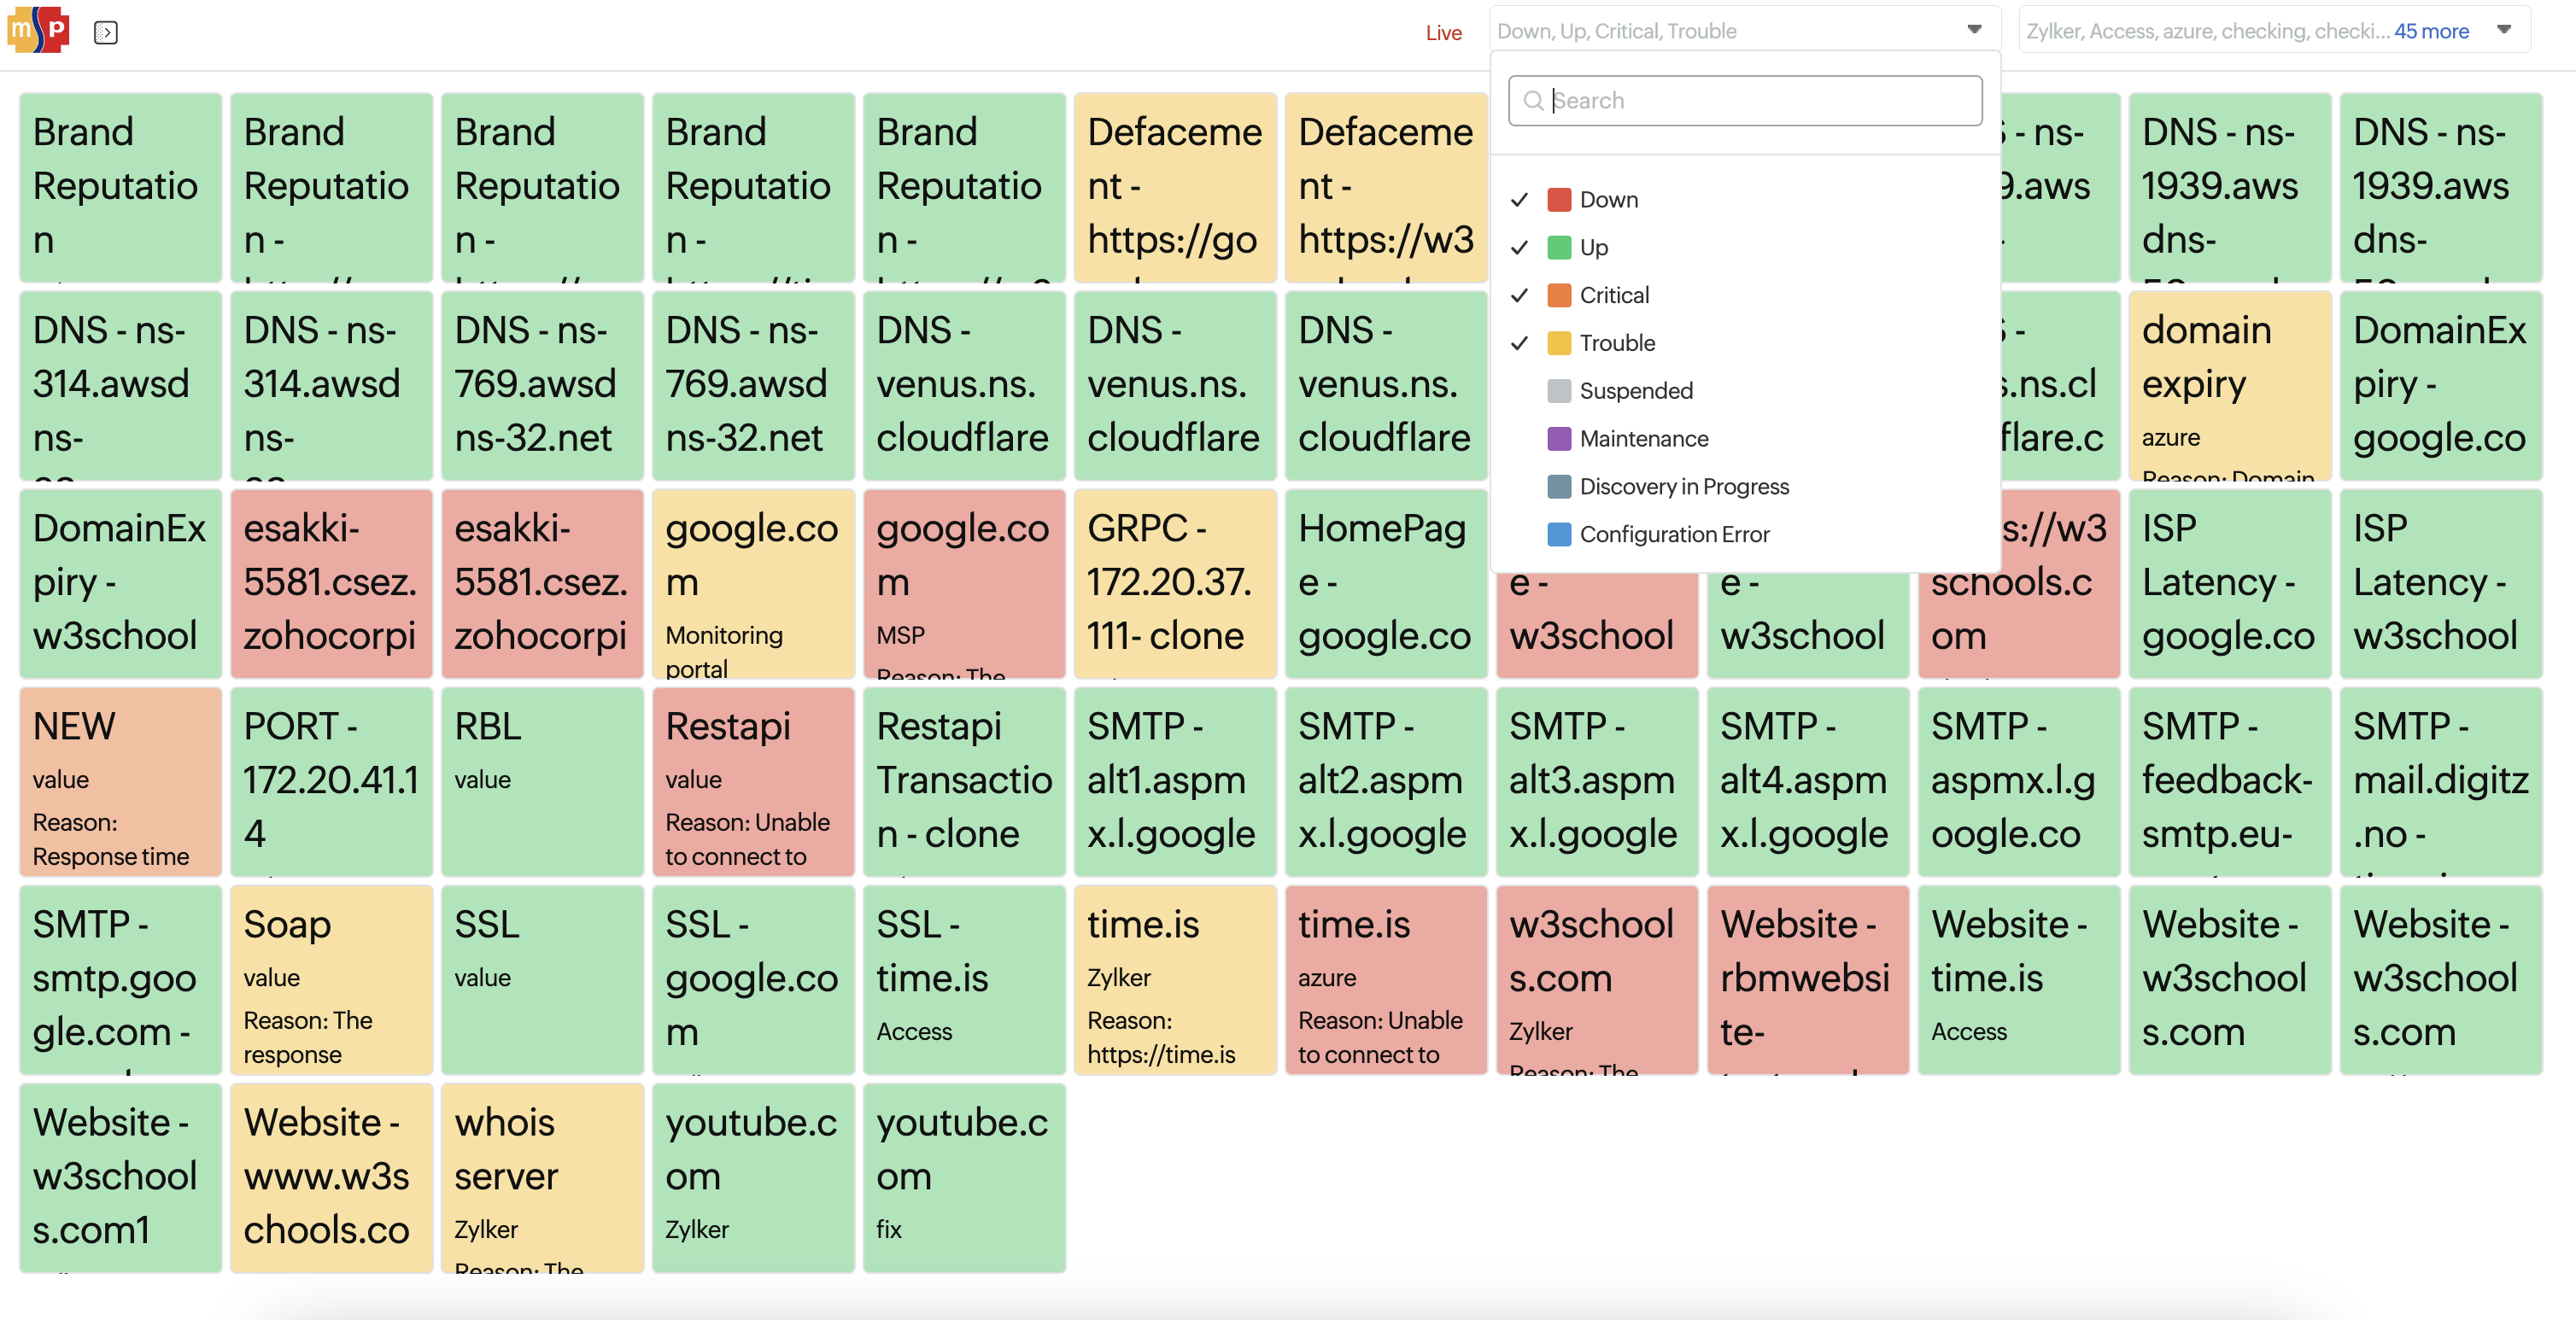
If you wish to see the (Network Operations Control) NOC View in your MSP account, just click the ![]() icon. In the NOC view, you can see the real-time status of all monitors in your MSP account inside a single dashboard without scroll. Individual monitors are depicted in a square tile, with unique color codes showing their real-time monitor status along with the relevant monitor's name and the customer name. With NOC view, you can fit in up-to 10K monitors in a single screen. Additionally, for Down or Trouble monitors, the reason for outage is also shown. NOC dashboard is no-click enabled. You also get to alter your NOC background by opting for a dark theme.
icon. In the NOC view, you can see the real-time status of all monitors in your MSP account inside a single dashboard without scroll. Individual monitors are depicted in a square tile, with unique color codes showing their real-time monitor status along with the relevant monitor's name and the customer name. With NOC view, you can fit in up-to 10K monitors in a single screen. Additionally, for Down or Trouble monitors, the reason for outage is also shown. NOC dashboard is no-click enabled. You also get to alter your NOC background by opting for a dark theme.
In addition to the Status filter (which lets you select monitors based on status like Up, Down, Trouble, Configuration Error, Maintenance, Discovery in Progress, and Susupended), you also get to filter the NOC dashboard based on Customer Accounts. If you select multiple customer accounts using this filter, the dashboard will render all the monitors from these customer accounts. While rendering this display, the dashboard will also take into Trouble account the status filter selected by you. By default, you will be shown all the monitors from all the customers' accounts associated to your MSP account. NOC view is independent of any roles and privileges.
Customer Groups
Customer Group allows you to create a unique customer roster to facilitate the better management of customer accounts. Each Customer Group can include up to 20 unique customer accounts. A customer account can only be linked to one group and cannot be associated with multiple groups, ensuring that each group has its own distinct set of customers.
Once a customer group is created, you can view the same under the Customer Groups' List View.
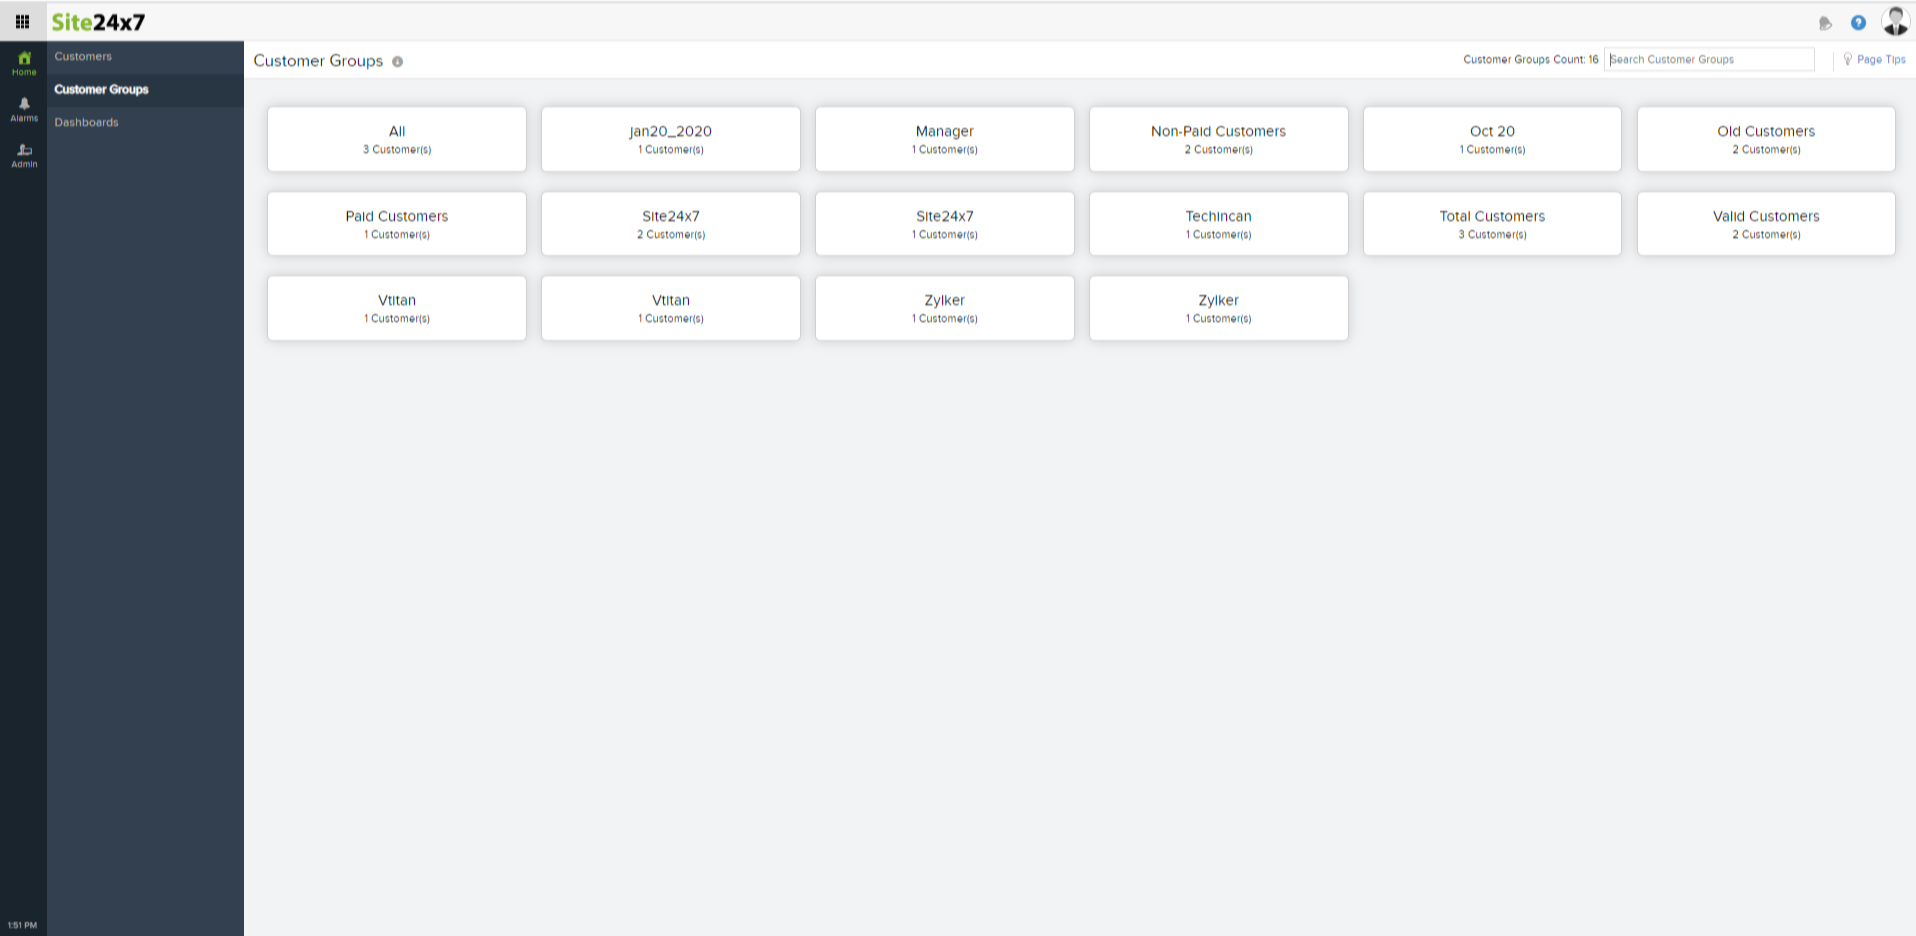
All the customers mapped will be listed under Customer Groups, and by clicking on the customer group, you can view the customers in that group. You can view the details of the customers in your customer group by navigating to Admin > Customer Groups. Customer groups without customers will not be listed under this option.
Know more about Customer Groups.
Filter and search customers
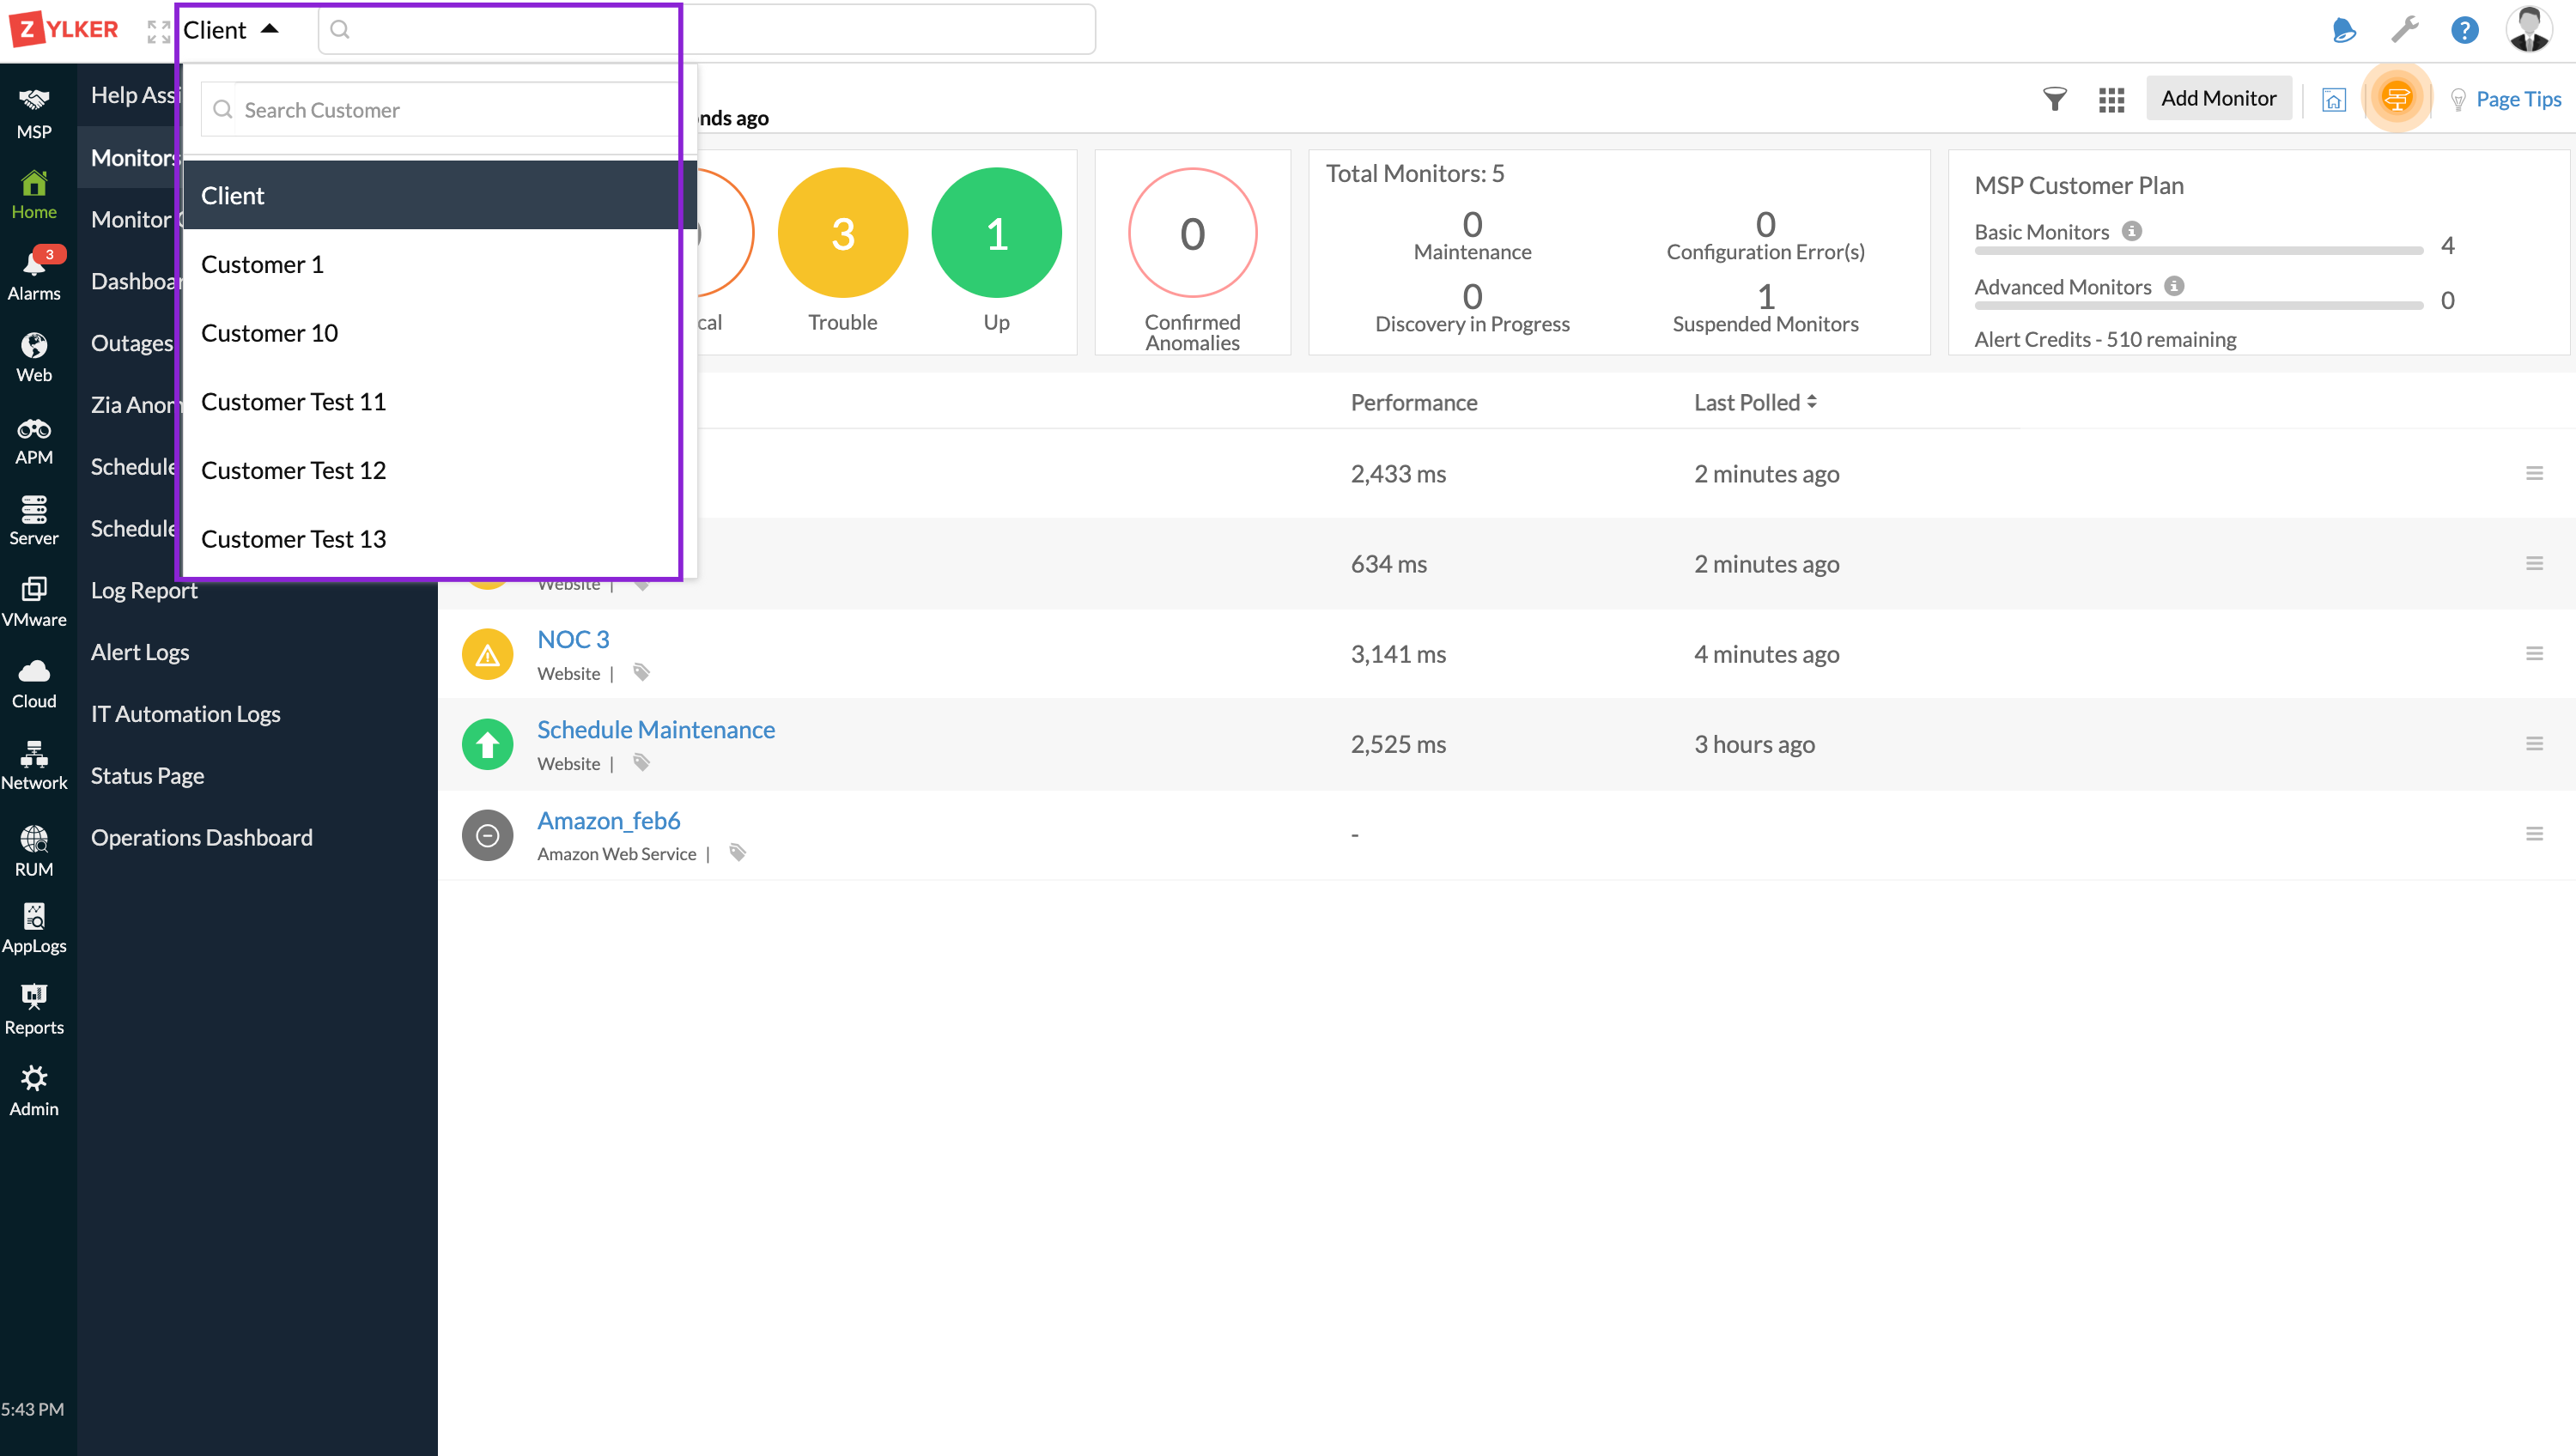
To view a particular customer, you can use the search box on the top left side of the Customer page to search and filter the account. You can also opt to open each account in a new tab by clicking the customer or customer status card.
